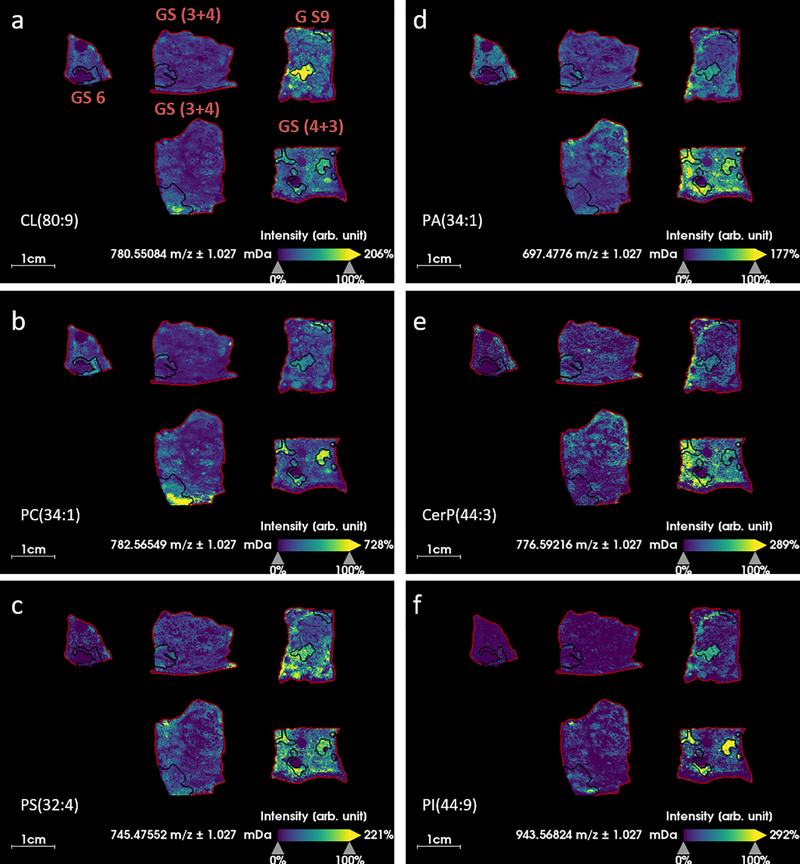
Fig. 4.
MALDI MS ion images of varying Gleason scores (GS) of prostate cancer tissue, regions outlined in black correspond with tumor regions annotated by an expert pathologist, a) m/z 780.5483 which is identified as cardiolipin CL(80:9) (Δppm = 0.18), b) m/z 782.5655 which is identified as phosphatidylcholine PC(34:1) (Δppm = 1.93), c) m/z 745.4755 which is identified as phosphatidylserine PS(32:4) (Δppm = 1.05), d) m/z 697.4776 which is identified as phosphatidic acid PA(34:1) (Δppm = 0.43), e) m/z 776.5922 which is identified as ceramide 1-phosphate CerP(44:3) (Δppm = 0.82), f) m/z 943.5682 which is identified as phosphatidylinositol PI(44:9) (Δppm = 1.34).

