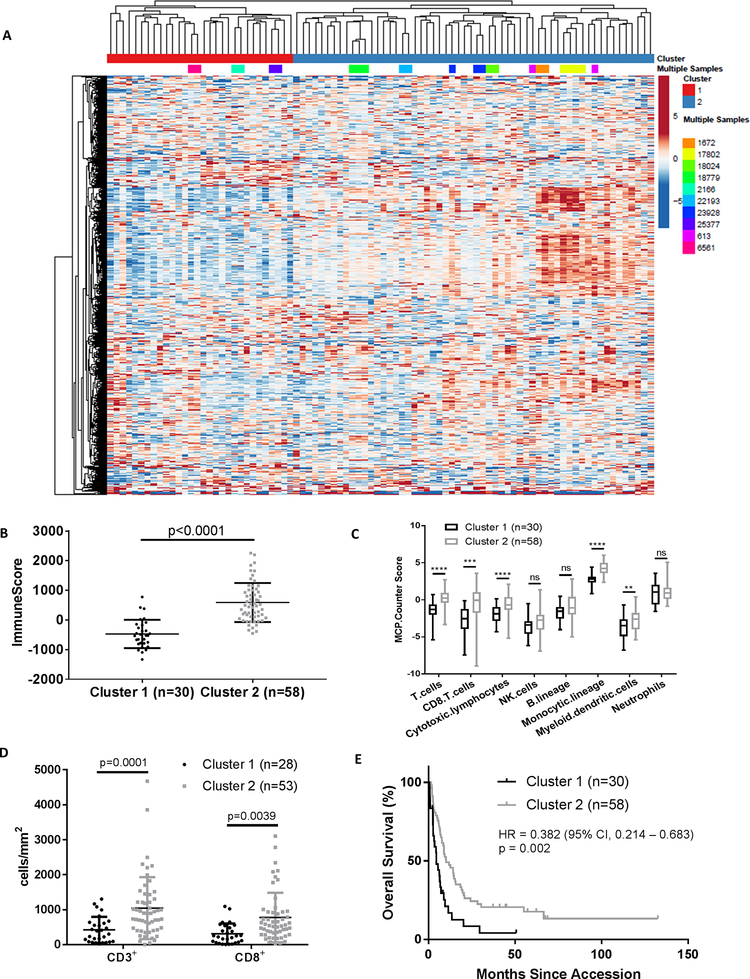
Figure 1: Unsupervised hierarchical clustering identifies immune cell signaling heterogeneity in melanoma brain metastases.
(A) Unsupervised hierarchical clustering of log2(FPKM+1) values for 1,030 Entrez genes from 88 MBMs. Genes that showed less than 1.5-fold change from the median in more than 75% of the samples were excluded from analysis. Samples from the same patient are colored identically. (B) ESTIMATE ImmuneScore analysis of MBMs in Clusters 1 (n=30) and 2 (n=58) identified by unsupervised hierarchical clustering. Lines represent mean ± S.D., and each dot represents a single sample. Significance determined via two-sided Student’s t-test. (C) MCP-Counter analysis of indicated immune cell populations in Clusters 1 (n=30) and 2 (n=58). Each plot is a simple box and whisker plot. Median values (lines) and interquartile range (whiskers) are indicated. ****P<0.0001, ***P <0.001, **P <0.01, ns: not significant (P>0.05) by two-sided Student’s t-test. (D) Comparison of CD3 and CD8 IHC staining results between MBMs from Clusters 1 (n=28) and 2 (n=53). Lines represent mean ± S.D., and each dot represents a single sample. Significance determined via two-sided Student’s t-test. (E) Kaplan-Meier OS analysis from craniotomy of patients in Clusters 1 (n=30) and 2 (n=58). Hazard ratio determined via Mantel-Haenszel test and significance by log-rank test.

