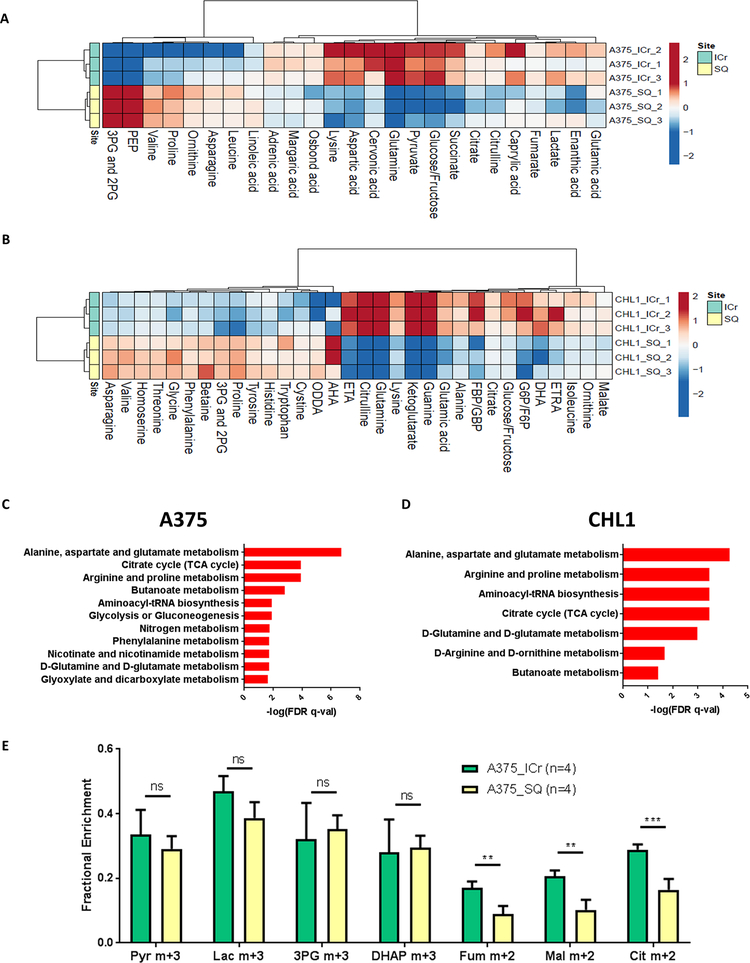
Figure 5: Metabolomics analyses confirm enrichment of oxidative phosphorylation in melanoma brain metastases.
(A-B) Liquid chromatography-mass spectrometry (LC-MS) analysis was performed on A375 and CHL1 intracranial (ICr) and subcutaneous (SQ) xenografts to identify differentially expressed metabolites (DEMs) (FDR q-val<0.25). The tricarboxylic acid (TCA) cycle metabolites fumarate, citrate, and succinate were significantly upregulated (log2FC>0 and FDR q-val<0.25) in A375 ICr xenografts, and the TCA cycle metabolites malate, citrate, and α-ketoglutarate were significantly upregulated in CHL1 ICr xenografts. Data are presented as heatmaps of median-centered log2-tranformed concentrations of all DEMs. (C-D) Metabolite set enrichment analysis (MSEA) of individual metabolites significantly upregulated (log2FC>0 and FDR q-val<0.25) in A375 and CHL1 ICr vs. SQ xenografts. All pathways listed are significantly enriched in ICr vs. SQ xenografts (FDR q-val<0.05). X-axis indicates degree of significance. Values were generated from three biological replicates per condition. (E) 13C enrichment in metabolites from ICr and SQ xenografts of A375 cells following infusions with [U-13C]-glucose. The fractional enrichment of metabolites is made relative to the enrichment of glucose in the tissue. Average values and S.D. for four biological replicates for each condition are displayed. Pyr, pyruvate; Lac, lactate; 3-PG, 3-phosphoglycerate; DHAP, dihydroxyacetone phosphate; Fum, fumarate; Mal, malate; Cit, citrate. ***P <0.001; **P <0.01; ns, not significant (P>0.05) by two-sided Student’s t-test.

