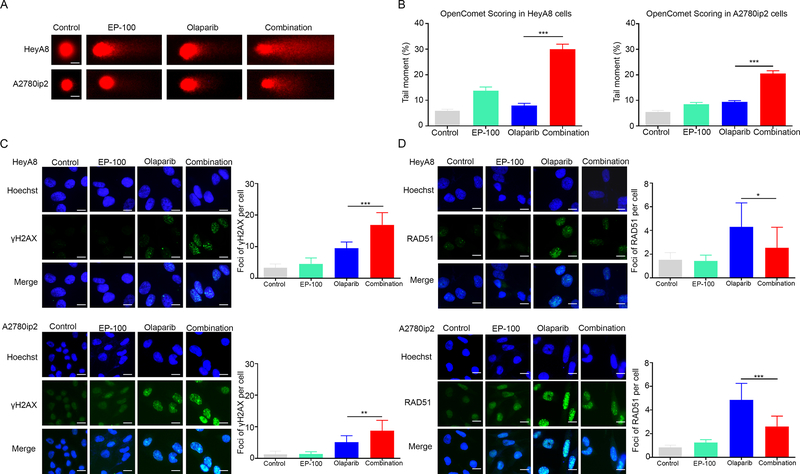
Figure 4. DNA damage accumulation in ovarian cancer cells treated with EP-100 and olaparib.
(A) Representative comets from comet assays of HeyA8 and A2780ip2 cells treated with a vehicle (control), EP-100 (1 μm), olaparib (10 μM), or EP-100 and olaparib. The time point for treatment is 24 h. (B) Mean tail moment percentages from three independent experiments. (C) Immunofluorescence stains (left panels) of γH2AX foci formation in HeyA8 and A2780ip2 cells 24 h after treatment with EP-100 and/or olaparib. The number of γH2AX foci per HeyA8 and A2780ip2 cells (right panels) calculated using the ImageJ software program (National Institutes of Health, Bethesda, MD, USA). (D) Immunofluorescence stains (left panels) of RAD51 foci formation and the number of RAD51 foci per cell (right panels) were shown. All experiments were repeated three times. Error bars are standard deviations. * p < 0.05, ** p < 0.01 and *** p <0.001. Scale bar: 20 μM.

