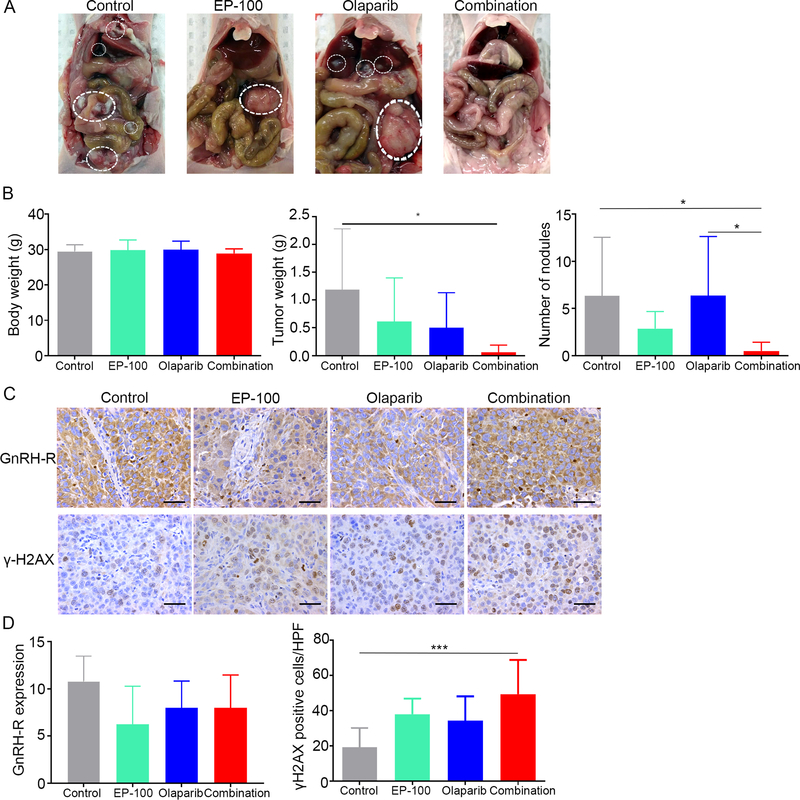
Figure 5. The combined effect of treatment with EP-100 and olaparib in vivo.
(A) Photographs of representative mouse from each group. (B) The body weights, tumor weights, and nodule numbers in mice inoculated with HeyA8 cells that received a vehicle (control), 0.2 mg/kg EP-100 (intravenously twice a week), 50 mg/kg olaparib (intraperitoneally daily), or a combination of EP-100 and olaparib (olaparib was given 1 h after EP-100) (n=8 per group). (C) Immunohistochemical stains and (D) statistical analysis of paraffin slides for the expression of GnRH-R and γH2AX. Five fields per slide and at least three slides (5 slides for control, EP-100, and olaparib each group, 3 slides for combination group due to the limited tissue after treatment) were examined. Bars represent means ± standard deviation. * p < 0.05 and *** p < 0.001. Scale bar: 50 μM.

