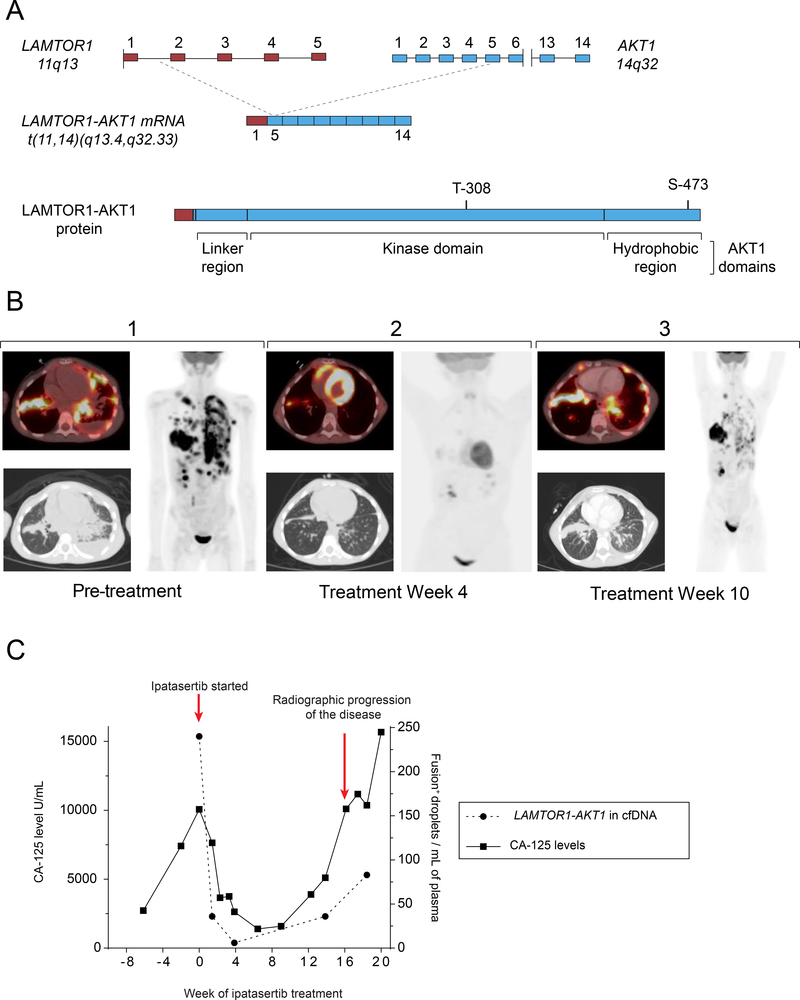
Figure 1. A Novel AKT1 Fusion-Driven Cancer.
A) Schematic diagram of the genomic DNA, mRNA, and protein structures of the LAMTOR1-AKT1 t(11,14)(q.13.4, q32.33) fusion; the top panel illustrates the fusion breakpoints within intron 1 of LAMTOR1 (red) and exon 5 of AKT1 (blue); the middle panel illustrates the resulting fusion mRNA structure; the bottom panel illustrates the protein structure, including the near-total removal of AKT1 PH domain, the retention of the entire kinase domain, and both phosphorylation sites (T308, S473). B) Representative computed tomography (CT) images of the chest and whole-body projections from 18fluorodeoxyglucose (FDG)-PET scans are shown; Panel 1 depicts tumor burden at the start of treatment with AKT inhibitor ipatasertib; Panel 2 depicts repeat imaging following 4 weeks of treatment with ipatasertib; Panel 3 depicts repeat imaging following 10 weeks of therapy. C) Dual axis graph comparing levels of the patient’s established tumor marker, CA-125, and the number of LAMTOR1-AKT1 fusion positive droplets per mL of plasma via a cell-free DNA assay over time

