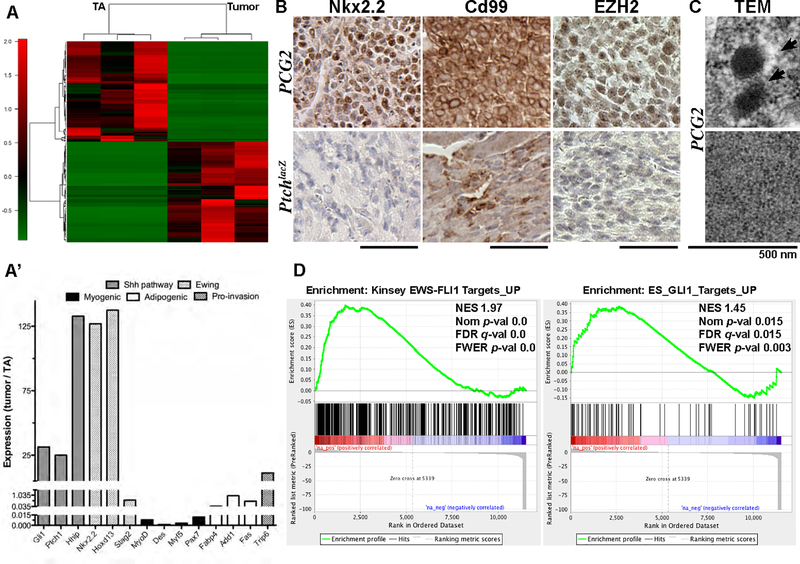
Figure 2. Exploring the PCG2 tumor transcriptome.
(A) Hierarchal clustering analysis of RNA-Seq data shows top 100 most differentially expressed genes from tumor versus unaffected tibialis anterior muscle in PCG2 mice (n=3). (A’) RPKM values show induction of Hh targets, ES-related genes, and select developmental genes in PCG2 tumors versus TA muscle. (B) Immuno-phenotype indicates PCG2 tumors, but not PtchlaZ eRMS, robustly express ES markers Nkx2.2 and Cd99, as well as methyltransferase EZH2. (C) TEM on ultra-thin PCG2 tumor sections. (D) GSEA shows enrichment of indicated gene sets. Scale bars are 50 μm.

