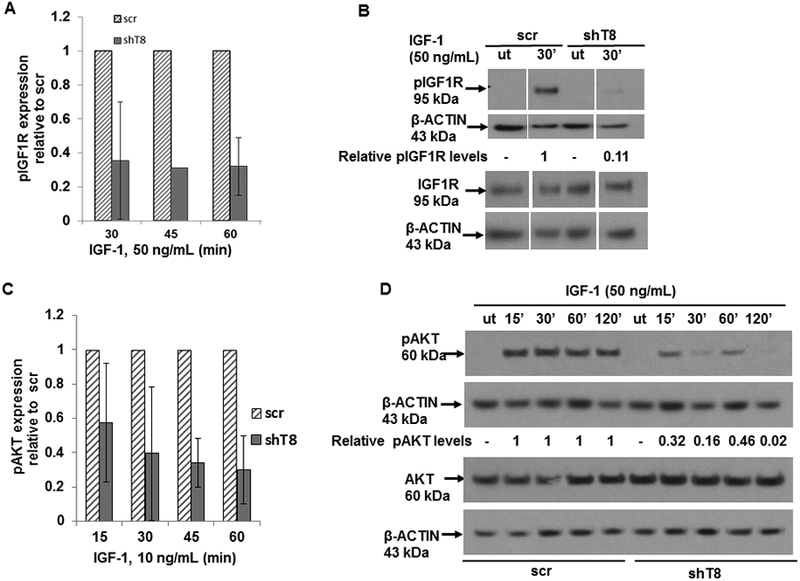
Figure 4. TNFAIP8 knockdown cells show suppression of pIGF1R and pAKT expression.

A. Quantification data showing suppression of pIGF1R expression in shT8 A549 cells versus scr cells at various times of treatment with IGF-1 (50 ng/mL). Values shown are mean ± SD from one (45 min) or two independent experiments (30 min and 60 min). B. Immunoblot showing decreased expression of pIGF1R in shT8 A549 cells versus scr cells in response to IGF-1. The same cell lysates were probed with pIGF1R and IGF1R antibodies, followed by reprobing with anti-β-ACTIN antibody. Gaps within the same immunoblot indicate non-relevant lanes that were digitally removed. C. Quantification data showing suppression of pAKT expression in shT8 A549 cells versus scr cells at 45 min and 60 min of treatment with low dose IGF-1. Values shown are mean ± SD from two independent experiments. D. Downregulation of pAKT expression in shT8 A549 cells versus scr cells in response to high dose IGF-1. The same cell lysates were probed with anti-pAKT and anti-AKT antibodies, followed by reprobing with anti-β-ACTIN antibody. ut, untreated.
