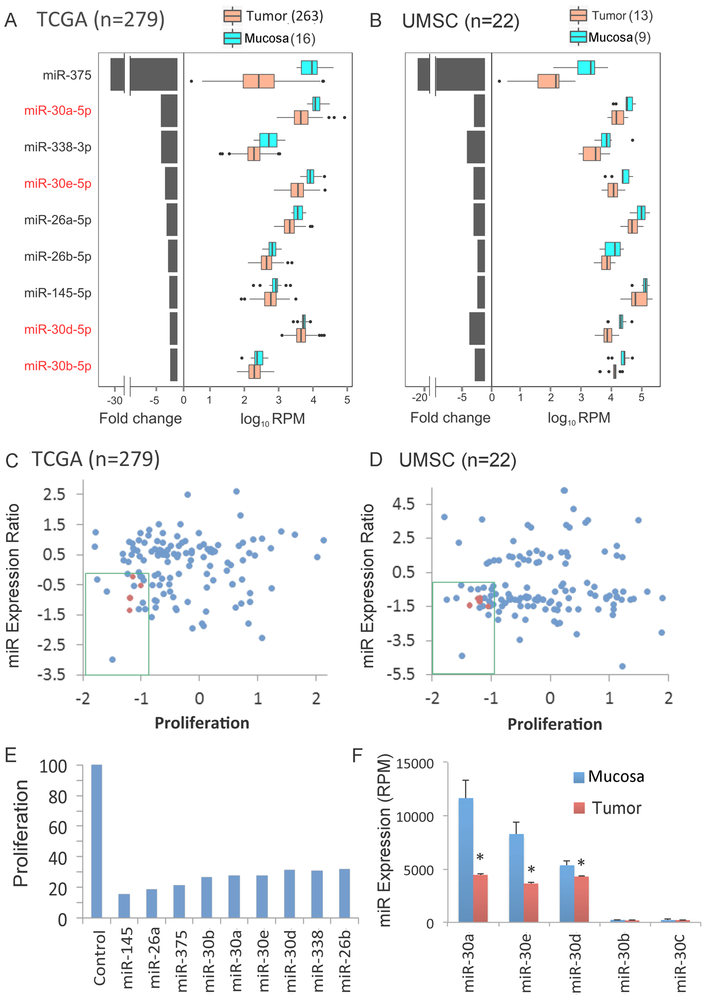
Fig. 1. Integrative genome-wide analysis identified decreased expression of miR-30 family members with anti-proliferative activity in HNSCC tissues and cell lines.
Nine miRNAs that were differentially abundant between tumor and normal mucosa control samples (q-value <0.2) in in TCGA (A) and independent UMSC (B) HNSCC tumor cohorts. Genome-wide mature microRNA profiling was performed using high throughput sequencing of human HNSCC tissues. TCGA: tumor=279, mucosa=16; samples from UMSC: tumor=13, mucosa=9. Left: median fold change between tumor and mucosa, presented on a linear scale. Right: expression distribution of mucosa and tumor presented as log10 RPM (reads per million base pairs). Medians, thick black lines; bars, 25th and 75th percentiles; outliers are displayed as individual points. Relationship of proliferation score to log2 miRNA tumor-mucosa expression ratio of TCGA (C) and UMSC (D) differentially expressed miRNAs (log2 tumor compared to mucosa in y axis) vs. proliferation score [Median Absolute Deviation (MAD)]. Anti-proliferative activity was determined in an in vitro genome wide RNAi screening in the HNSCC cell line UM-SCC-1 as described in Methods. The green box denotes miRNAs that are repressed in tumor tissue and exhibit anti-proliferative activity. miR-30-5p family members are highlighted in red. (E) Anti-proliferative effect of miRNA mimics, 96 hours after transfection into UM-SCC-1, as percentage of control miRNA mimic. (F) Expression of miR-30 family members in mucosa and tumor specimens from the TCGA cohort. Bars represent SEM and * denotes q < 0.2 as reported by SAMseq. miR-30a-5p and miR-30e-5p display the highest expression in mucosa specimens and the greatest reduction in tumor specimens.

