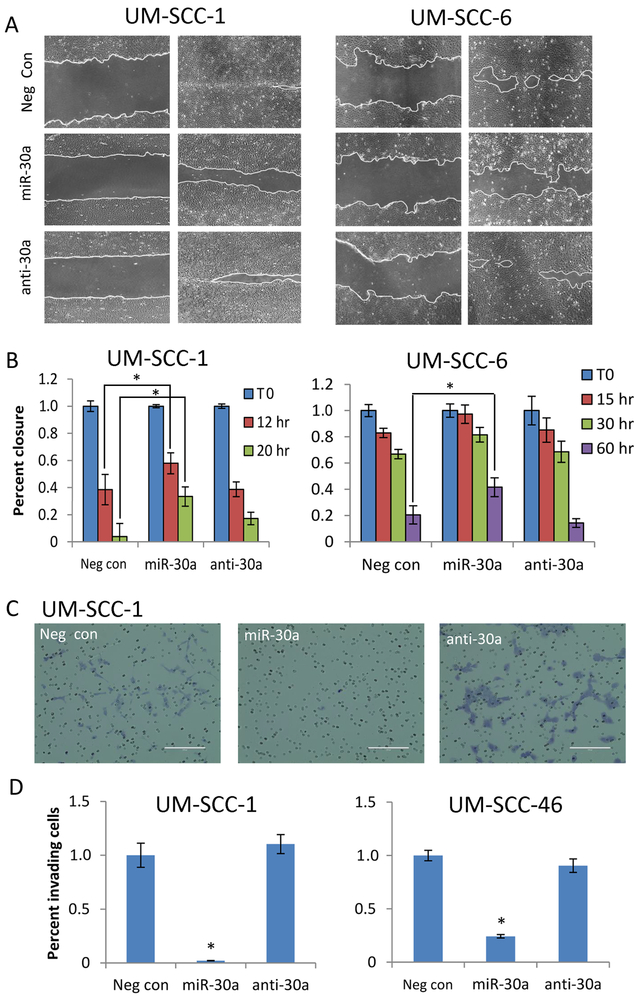
Fig. 4. Ectopic expression of miR-30a-5p reduces HNSCC cell migration and invasion.
(A) Representative light microscopy images (100x) for wound closure in a cell migration assay. UM-SCC-1 (left) and UM-SCC-6 cells (right) were transfected with miR-30a-5p or anti-miR-30a-5p oligonucleotides for 48 h before wound scratch creation. Cell migration was observed until wound closure in controls. UM-SCC-1, left, time 0; right, time 20hrs. UM-SCC-6, left, time 0; right, time 60hrs. (B) Cell invasion assay. UM-SCC-1 and UM-SCC-46 cells were transfected with neg control, miR-30a-5p, or anti-miR-30a-5p oligonucleotides for 48 h, then trypsinized and placed in a matrigel coated trans-well migration chambers. 50 ng/mL rEGF was placed in the bottom wells as a chemoattractant. After a 20 h incubation, invasion membranes were fixed and stained to quantify invading cells. (C) Representative light microscopy images (100x) of invasion membranes are shown for UM-SCC-1. (D) Relative quantitation of invading cells for UM-SCC-1 (left) and UM-SCC-46 (right). All data represents the mean of at least three experiments and error bars represent SEM. * denotes p < 0.05 by a Student’s T-test for statistical comparison with either negative control or anti-miR30a.

