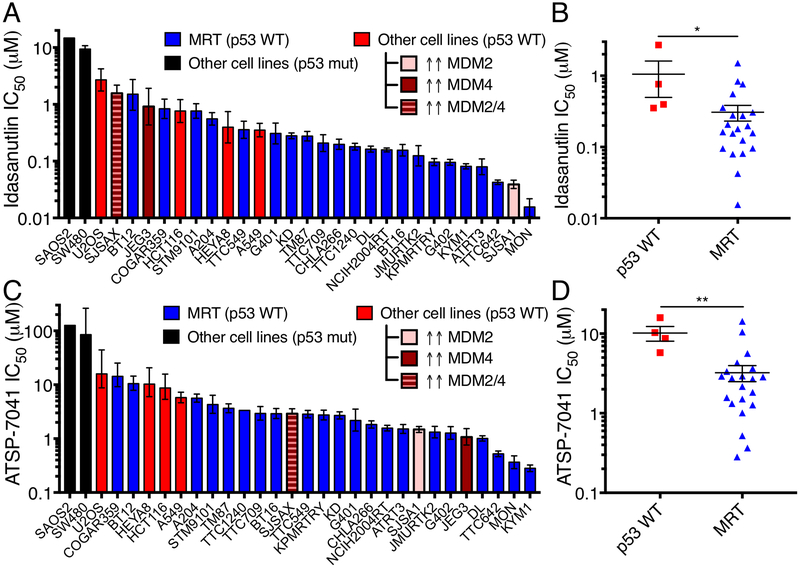
Figure 2.
MRT cell lines are more sensitive to MDM2 and MDM2/4 inhibition than other p53 wild-type cell lines. (A) IC50 for idasanutlin in cell lines calculated from dose response curves. Controls include p53 WT cells, a subset with amplification/over-expression of MDM2/4. Data show mean ± 95% CI from three biological replicates. (B) IC50 of p53 WT, non-MDM2/4 amplified cell lines and MRT cells. Each point represents one cell line from A. Data show mean ± SEM. Significance calculated by a two-sided t-test. (C-D) IC50 for ATSP-7041 in cell lines, as plotted in A-B. *- P<0.05; **- P<0.01.

