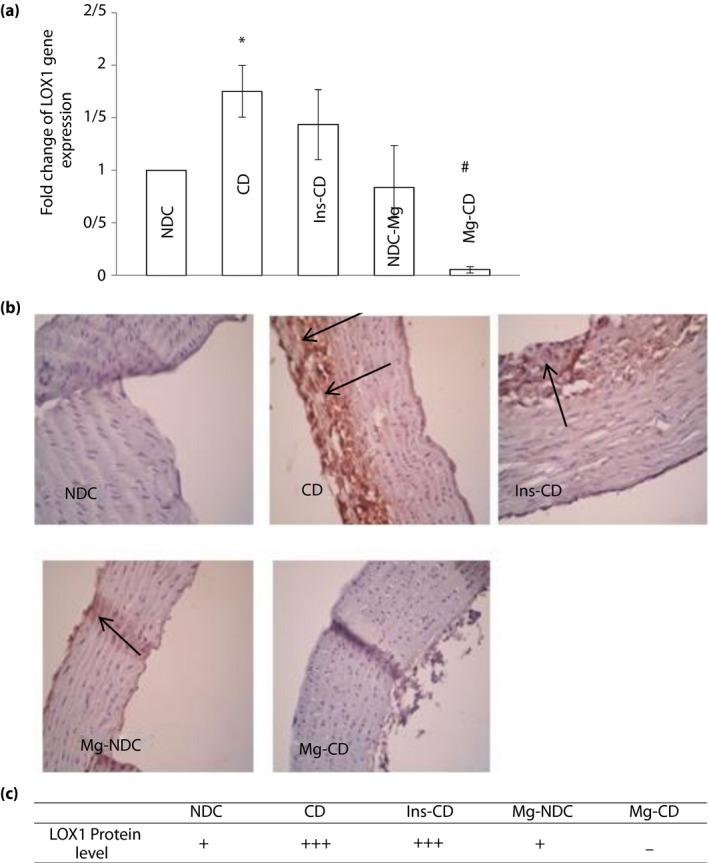
Figure 4.

Comparison of (a) lectin‐like low‐density lipoprotein receptor‐1 (LOX‐1) gene expression and (b,c) immunohistochemistry for LOX‐ 1 in non‐diabetic control (NDC), chronic diabetic (CD), Mg‐treated non‐diabetic control (Mg‐NDC), insulin‐treated chronic diabetic (Ins‐CD) and Mg‐treated chronic diabetic (Mg‐CD) groups (10 rats in each group, data are expressed as mean ± standard error of the mean and protein level of LOX‐ 1 is shown by black arrows). *Significant difference between CD and other groups (P < 0.01). #Significant difference between the Mg‐CD and Ins‐CD and Mg‐NDC groups (P < 0.01).
