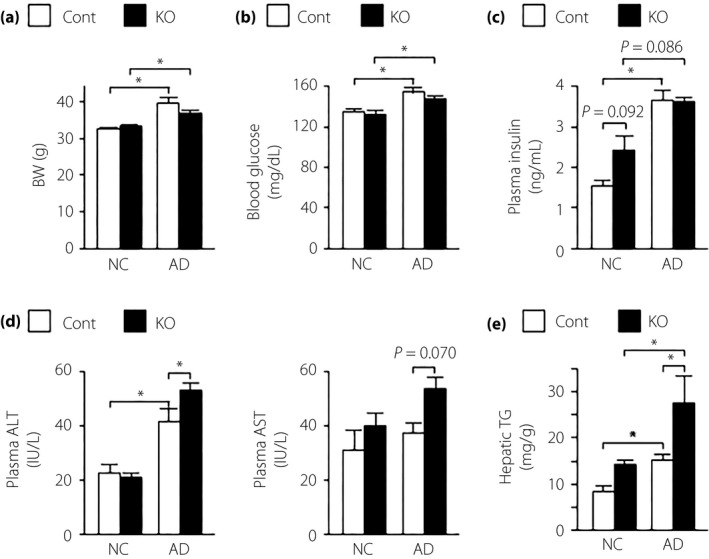
Figure 1.

(a) Body weight (BW), (b) blood glucose, (c) plasma insulin, (d) plasma aspartate aminotransferase/alanine aminotransferase (ALT/AST) and (e) hepatic triglyceride (TG) content in mice fed normal chow (NC) or an atherogenic high‐fat diet (AD) for 32 weeks. Values are the mean ± standard error of the mean (NC‐control [Cont], n = 4; NC‐knockout [KO], n = 5; AD‐Cont, n = 6; AD‐KO, n = 10). *P < 0.05.
