Figure 1.

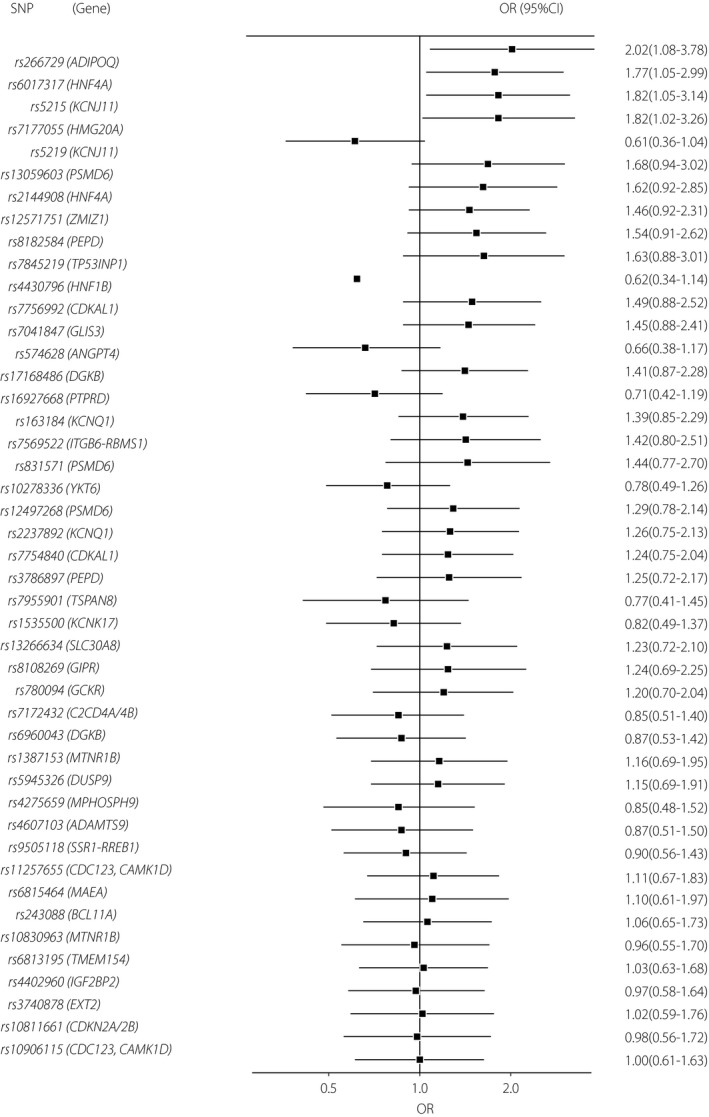
Forest plot of per‐allele odds ratio of 45 single‐nucleotide polymorphisms assessed in the present study. CI, confidence interval; OR, odds ratio; SNP, single‐nucleotide polymorphism.

Forest plot of per‐allele odds ratio of 45 single‐nucleotide polymorphisms assessed in the present study. CI, confidence interval; OR, odds ratio; SNP, single‐nucleotide polymorphism.