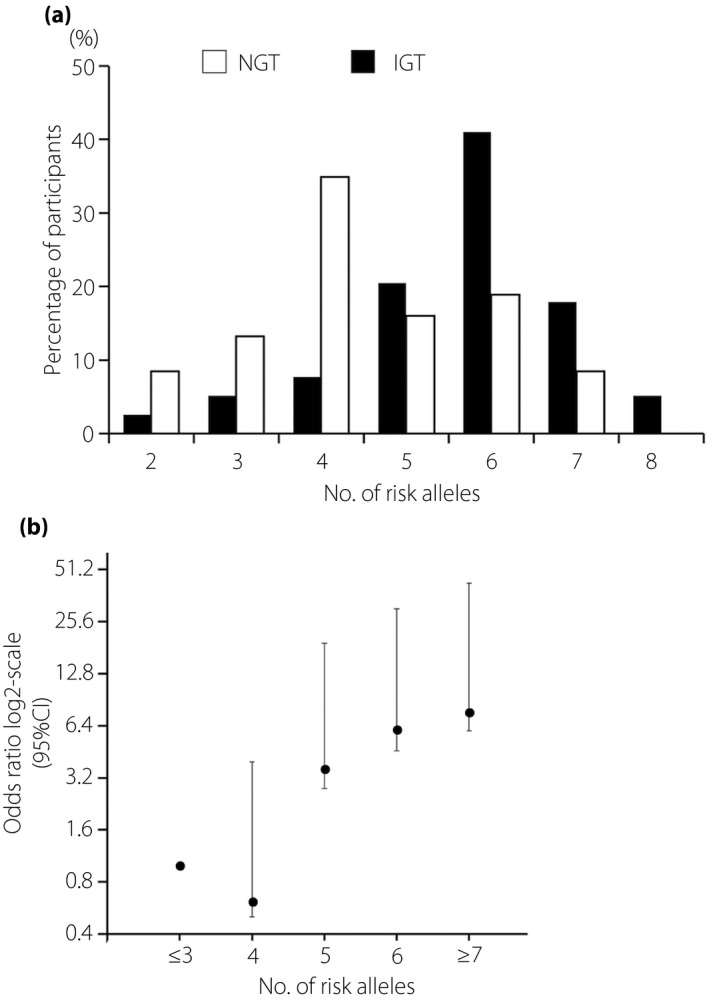
Figure 2.

Risk alleles of four genetic variants and the development of postpartum abnormal glucose tolerance (pAGT). (a) Distribution of risk alleles of four genetic variants in postpartum abnormal glucose tolerance and normal glucose tolerance (NGT). Black bars: abnormal glucose tolerance (n = 59); white bars: NGT (n = 154). (b) Odds ratio for the risk of postpartum abnormal glucose tolerance according to the number of risk alleles carried. 95% CI, 95% confidence interval; IGT, impaired glucose tolerance.
