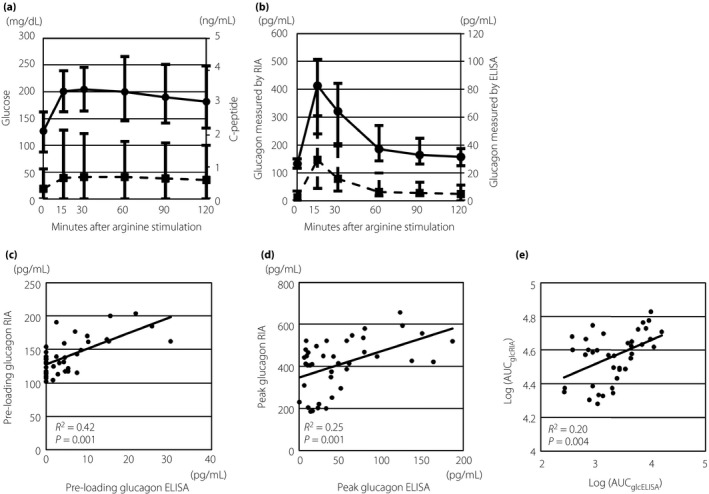
Figure 1.

Trends in responses to arginine stimulation and coefficients of plasma glucagon measurements by radioimmunoassay (RIA) and enzyme‐linked immunosorbent assays (ELISA). (a) Trends in plasma glucose (solid line with circles) and serum C‐peptide (dashed line with squares) responses to arginine stimulation. (b) Trends in plasma glucagon responses to arginine stimulation measured by RIA (solid line with circles) and ELISA (dashed line with squares). (c) Scatterplot of plasma glucagon levels at preloading measured by RIA and ELISA. (d) Scatter plot of peak levels of plasma glucagon measured by RIA and ELISA. (e) Scatter plot of logarithm‐transformed area under the curve (AUC) of glucagon measured using radioimmunoassays (log[AUC glc RIA]) and logarithm‐transformed AUC of glucagon measured using enzyme‐linked immunosorbent assays (log[AUC glc ELISA]). Solid lines in (c–e) show approximate lines between each measurement.
