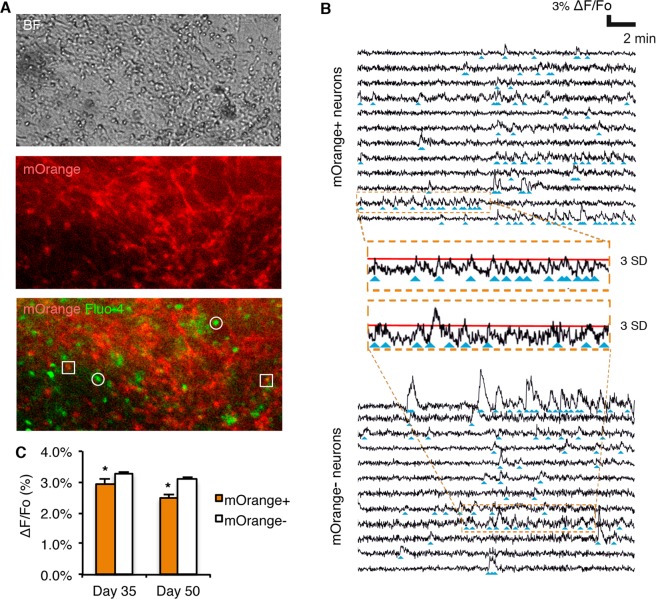
Figure 3.
Ventral midbrain dopaminergic neurons show intrinsic electrical properties different from ventral midbrain non-dopaminergic neurons. (A) Live images in bright field (top picture) and the corresponding mOrange and Fluo-4 AM (middle and bottom pictures) fluorescent signal of differentiated neurons (Day 50) during calcium imaging. Squares in the bottom picture point to mOrange+ dopaminergic neurons whereas circles point to mOrange− non-dopaminergic neurons in which oscillations of Fluo-4 AM fluorescence are measured. (B) Calcium traces of selected mOrange+ and mOrange− neurons confirm electrophysiological activity. Blue arrowheads point to neuronal firing events. Insets show in detail calcium traces from individual mOrange+ or mOrange− neurons. Red line represents an increase in fluorescence equivalent to 3 standard deviations (SD) of the mean of the baseline noise. (C) Quantification of the average amplitude of the firing events of mOrange+ and mOrange− after 35 and 50 days of differentiation. Data show the average ± S.E.M. of two or three independent experiments. At day 35, 130 mOrange+ and 1187 mOrange− cells from 3 independent experiments. At day 50, 124 mOrange+ and 1034 mOrange− cells from 2 independent experiments. Asterisk denotes statistically significant differences (*p < 0.05).

