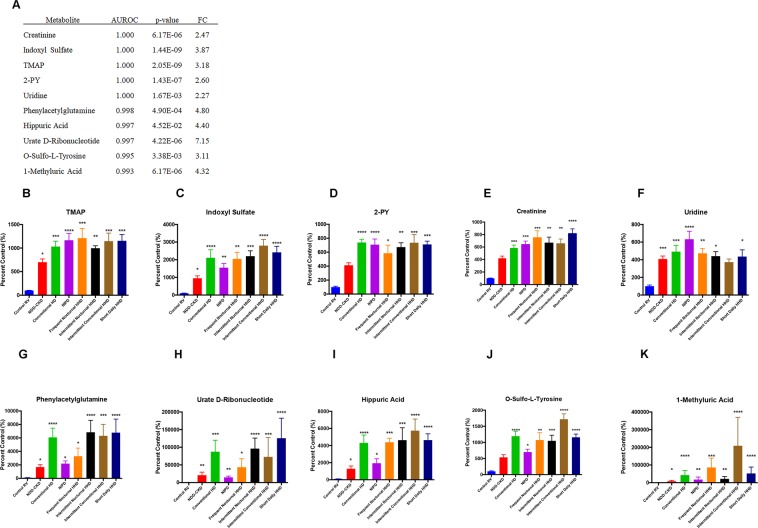
Figure 5.
Diagnostic performance of the top 10 plasma metabolites found to accurately predict decreased kidney function in ESRD. Metabolites are ranked by area under the receiver operating characteristic (AUROC) curve and p-value (A). Plasma levels of indoxyl sulfate (%CV = 5.9, B), N,N,N-trimethyl-L-alanyl-L-proline betaine (TMAP, %CV = 6.2, C), N-methyl-2-pyridone-5-carboxamide (2-PY, %CV = 7.1, D), creatinine (%CV = 9.0, E), uridine (%CV = 8.3, F), phenylacetylglutamine (%CV = 5.4, G), urate d-ribonucleotide (%CV = 7.2, H), hippuric acid (%CV = 7.4, I), o-sulfo-L-tyrosine (%CV = 8.1, J) and 1-methyluric acid (%CV = 7.2, K) are presented for control RV (n = 10), non-dialysis dependent CKD (NDD-CKD, n = 20), conventional hemodialysis (conventional HD, n = 10), nocturnal intermittent PD (NIPD, n = 10), frequent nocturnal HHD (n = 5), intermittent nocturnal HHD (n = 5), intermittent conventional HHD (n = 5), and short daily HHD (n = 6). Data is presented as mean ± SEM, n = 10, *p < 0.05, **p < 0.01, FC = fold change.

