Fig. 1.
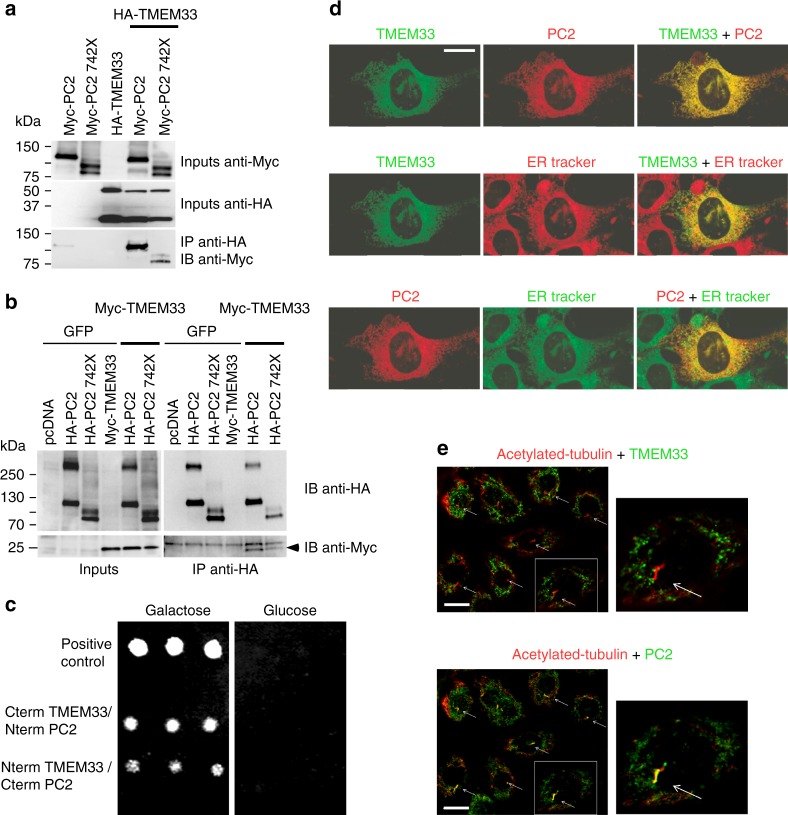
TMEM33 interacts with PC2 at the ER membrane of PCT cells. a Co-immunoprecipitation of TMEM33 with PC2 in PCT cells when TMEM33 is pulled down. A pathologic PC2 deletion mutant PC2–742X was also tested. b Same, but when PC2 is pulled down. Arrowhead indicates TMEM33 and the upper band is non-specific. c Yeast two hybrid experiments indicating an interaction (direct or indirect) between TMEM33 and PC2. We used a yeast strain with chromosomal LEU2 reporter gene harboring LexA operator binding sites. As a second reporter we used GFP under the control of the LexA operator (URA). The bait was either the COOH or NH2 terminus of TMEM33 expressed in frame with LexA (HIS), and the prey was either the COOH or NH2 terminus of PC2 expressed in frame with B42. As a further selection the prey product is only expressed in the presence of galactose. For a positive interaction, the yeast need to grow on medium -HIS-TRP-URA-LEU + Galactose and light up positive for GFP. As a positive control we used LexA-p53 with B42-LTA. As negative controls, we either expressed the LexA-CtermTMEM33 with the empty prey vector or B42-CtermPC2 with the empty bait vector. No growth was observed with any combination of either prey alone or bait alone. d Top: Co-localization of TMEM33-GFP (green) and mCherry-PC2 (red) in PCT cells; Middle: co-localization of TMEM33-GFP (green) with ER tracker as an ER marker (red); Bottom: co-localization of mCherry-PC2 (red) with ER tracker (green). The merged image (yellow shows co-localization) is shown at the right. False colors were used to consistently illustrate co-localizations in yellow (ER tracker blue). The scale bar corresponds to 20 μm. e TMEM33 is absent at the primary cilium, unlike PC2. Acetylated-tubulin in red labels the primary cilia and TMEM33 (top panels) or PC2 (bottom panels) are labeled in green (false colors). Co-localization of PC2 and acetylated tubulin is seen in yellow (merged image; bottom panels). The right panels are magnification of the boxed area shown in the left panels. Arrows indicate primary cilia. The scale bar corresponds to 15 μm. Source data are provided as a Source Data file

