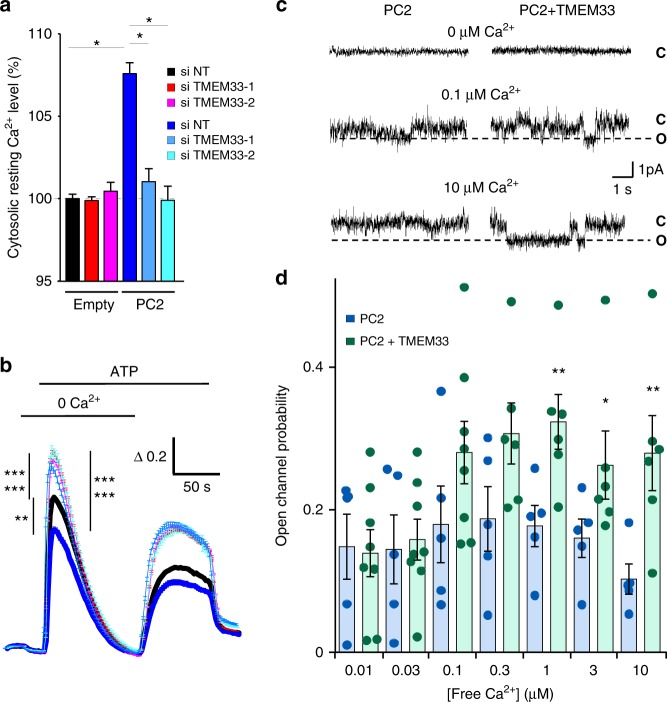
Fig. 3.
TMEM33 controls the calcium-dependent gating of PC2. a Increases in cytosolic calcium concentration are expressed as ratios of 340:380 nm fluorescence signals (ΔR/R0). Relative (to the siNT empty vector condition; black bar) basal cytosolic calcium levels in PCT cells transfected or not with siRNAs against TMEM33 (red and magenta bars). The effect of PC2 overexpression (as indicated at the bottom of the graph) was also investigated (dark blue bar, siNT and light blue bars: siTMEM33–1 and siTMEM33–2). Experimental points are available in the data source file. Numbers of cells analyzed are indicated in Fig. 2 and (b) legends. b ATP-induced calcium transients in the absence of extracellular calcium (siNT, n = 2353; siTMEM33–1, n = 2437; siTMEM33–2, n = 2201; siNT + PC2, n = 262; siTMEM33–1 + PC2, n = 246, siTMEM33 + PC2, n = 322). Same cells as in (a). c PC2 channel activity elicited with 0, 0.1 and 10 μM free calcium on the cis-side (cytosolic) in ER liposomes fused to planar bilayers (holding potential: 0 mV). As previously reported, the slope conductance of the channel was 85 pS when PC2 was activated by cytosolic calcium7, 10. C indicates the closed state and O the open state (dashed line). d Open channel probability of PC2 measured at increasing concentration of free cytosolic calcium (PC2: blue bars and PC2 + TMEM33: green bars). Values are means ± SEM overlaid with dot plots for (d). One star indicates p < 0.05, two stars p < 0.01 and three stars p < 0.001, with a Student’s t test for (a, b), as well as a Mann–Whitney test for (d) used to evaluate statistical significance. Source data are provided as a Source Data file

