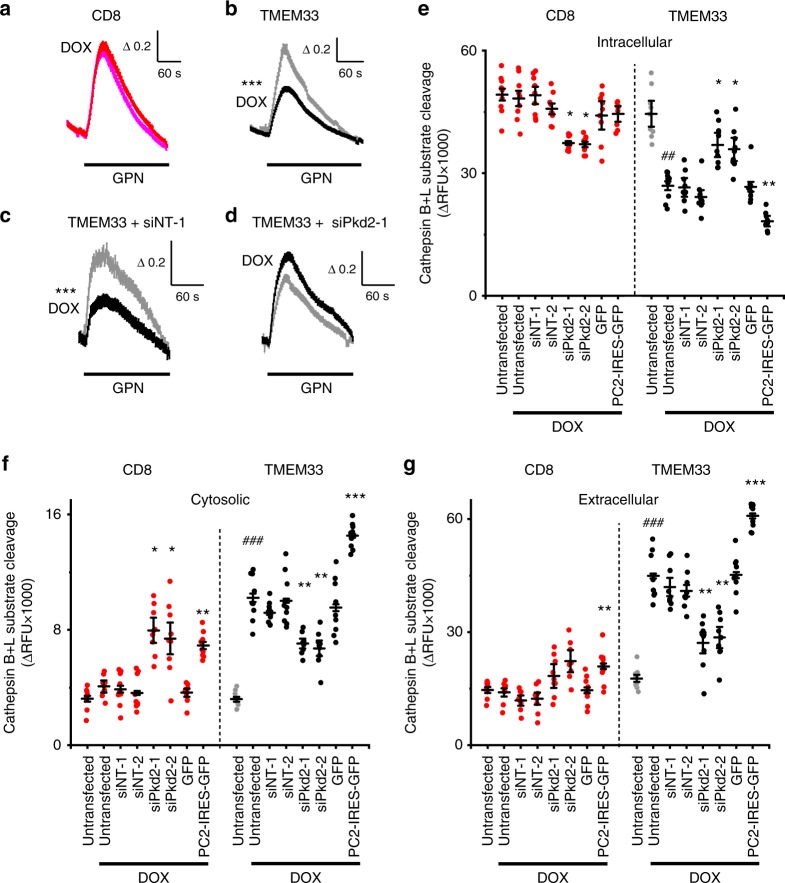
Fig. 4.
TMEM33 inhibits endolysosomal calcium refilling and induces cathepsins translocation. a Increases in cytosolic calcium concentration are expressed as ratios of 340:380 nm fluorescence signals (ΔR/R0). GPN (250 μM) response in the absence of extracellular calcium in a conditional PCT cell line expressing CD8ER in the presence of DOX (magenta trace, n = 692), as compared to the non-induced condition (red trace; n = 706). b Same in a conditional PCT cell line expressing TMEM33 in the presence of DOX (black trace; n = 548) or without induction (gray trace; n = 620). c GPN response in cells transfected with siNT (n = 204 and n = 224, in the absence [gray trace] or the presence of DOX [black trace], respectively). d Knockdown of Pkd2 (coding for PC2) suppresses the effect of TMEM33 (n = 361 and n = 422 in the absence and in the presence of DOX, respectively). e Effect of Pkd2 knock-down or PC2 overexpression on intracellular cathepsins B/L content. CD8: red dots; TMEM33 non induced: gray dots; TMEM33 induced: black dots. f Same for cytosolic cathepsins. g Same for extracellular cathepsins. Values represent average peak ∆RFU values for n = 3 independent transfection experiments done in triplicate. * compared to respective untransfected DOX induced controls and # compared to respective non-induced controls. Bars are means ∆RFU ± SEM overlaid with dot plots for e-g. One star indicates p < 0.05, two stars p < 0.01 and three stars p < 0.001, with a Student’s t-test used to evaluate statistical significance. Source data are provided as a Source Data file

