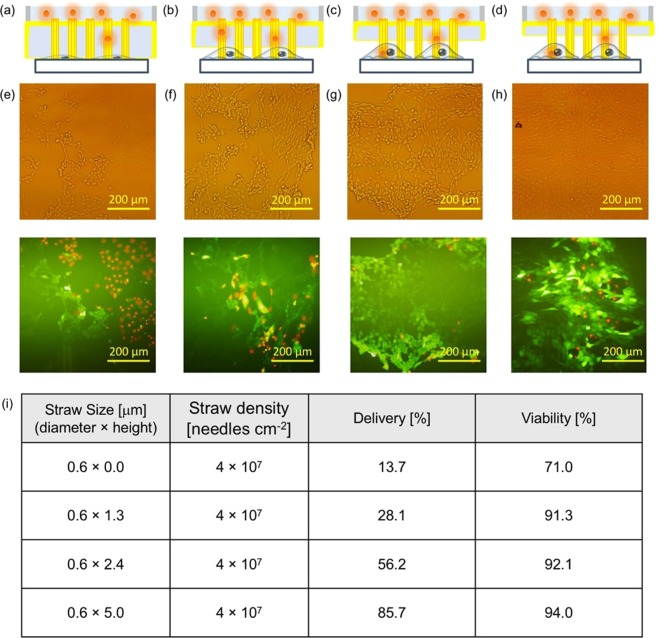
Figure 5.
Direct delivery of molecules into NIH-3T3 cells. (a–d) Schematics of Au nanostraw membrane stamping into cells with different nanostraw heights of 0 (a), 1.3 (b), 2.4 (c), and 5.0 µm (d). (e–h) Optical and fluorescence images after the calcein and PI delivery using 0- (e), 1.3- (f), 2.4- (g), and 5.0-µm-high nanostraws (h). Total cell number N = 224 in (e), 476 in (f), 535 in (g) and 494 in (h). (i) Summarized data of nanostraw size and density, molecular delivery, and viability.

