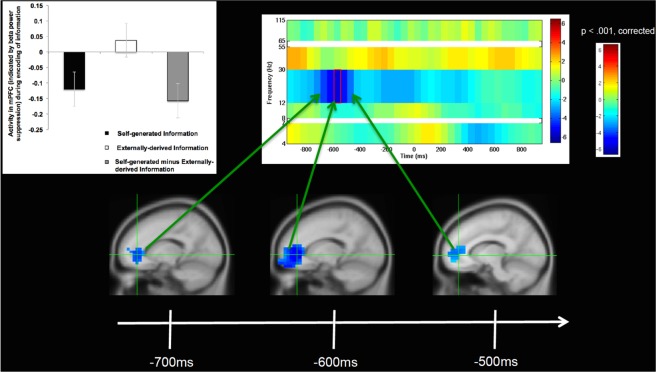
Figure 2.
Self-generated Information Encoding Time Windows: Group analyses of changes only in beta (12–30 Hz) oscillatory power, indicating significant increases in mPFC activity during self-generated encoding (i.e., during encoding of self-generated vs. externally-derived information) only within the specific limited time windows shown between −700 to −500 ms prior to vocalization onset (0 ms). All images shown here are cluster corrected (>50 contiguous voxels) on statistical maps thresholded at p < 0.001, cross-hairs centered at the peak of mPFC activity (x, y, z = −15,40,0). Bar charts illustrate beta weights averaged across all participants for each condition, and are shown at the peak of mPFC activity during encoding of self-generated vs. externally-derived information.

