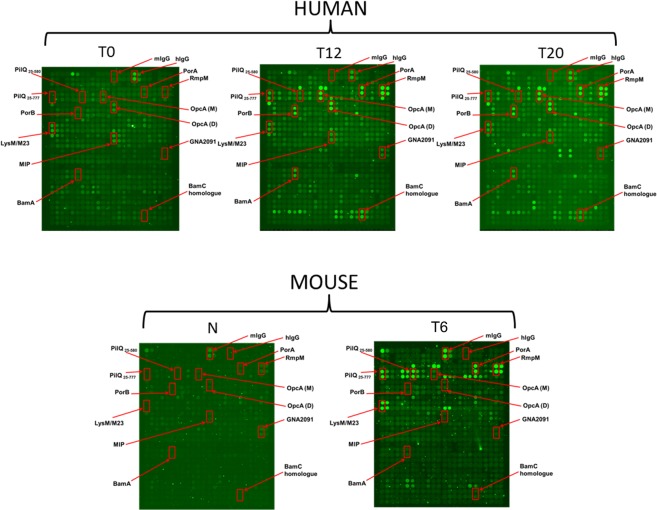
Figure 2.
Exemplar raw data microarrays of human or mouse IgG seroreactivity. The microarrays were hybridized with human or mouse sera and developed for total IgG. T0 or naïve (N) represents pre-vaccination serum, T12 and T20 represent post-vaccination collection the 12 and 20 week time points respectively from the human high dose vaccinees while T6 represents terminal bleed from vaccinated mice after 2 doses. Spots representing highly immunogenic proteins in human or mouse sera are blocked in red. Duplicate spots are shown; the third replicate spot is not in close proximity to the first two spots.

