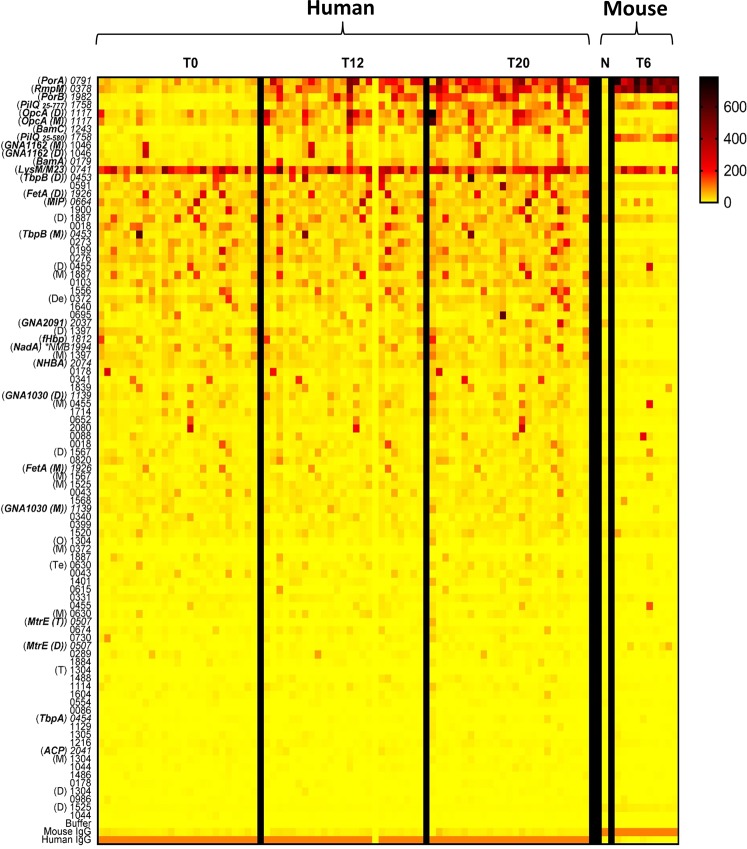
Figure 3.
IgG seroreactivity of immuno-dominant OMPs at different vaccination time points. Reactivity of immunogenic proteins to pre- (T0 or N) and post-vaccination (T12 or T20) sera from 25 human vaccinees and 10 mice (T6) are quantified and represented as a heat map. The colour blocks represent the fluorescence signal intensity for reactivity against total IgG antibodies in serum. Antigens are ranked according to magnitude of difference between human T20 and T0. PilQ25–777 represents the full length protein while PilQ25–580 is missing the C-domain. Proteins are represented as the last 4 digits of their gene numbers (NMBH4476_), letters represent the oligomeric state (M, monomer; D, dimer; T, trimer; Te, tetramer; O, octamer; De, decamer). *NMB 1994 (NadA) is not expressed in strain H44/76 and was obtained from MC58 strain. More details on the individual proteins are given in Supplementary Table S2.

