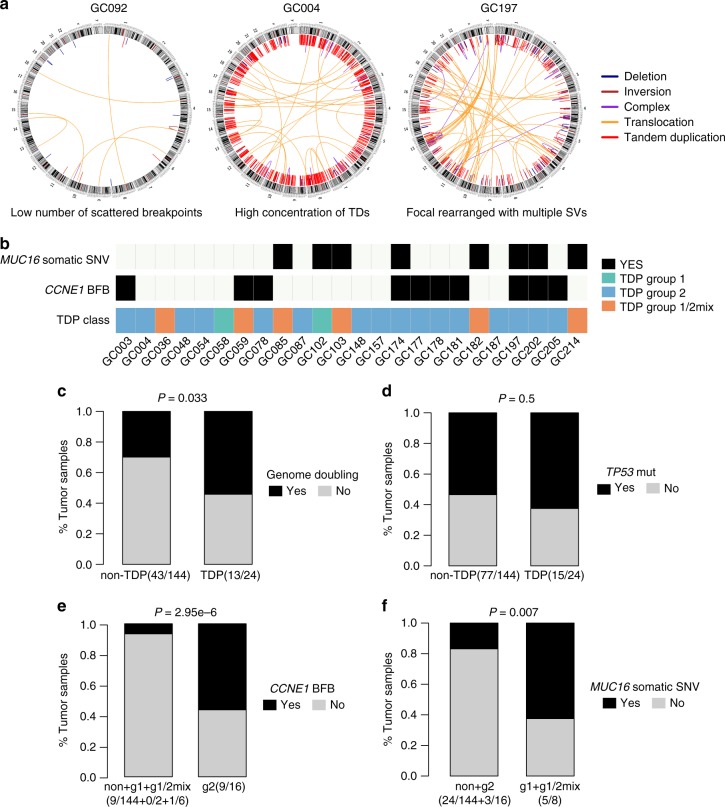
Fig. 2.
Classification of TDP in GC. a Circos plots describing somatic rearrangements, with chromosomal ideograms located on the outermost right side and lines representing rearrangements. b Colored squares indicate MUC16 somatic mutation status, CCNE1 BFB status and TDP status of 24 TDP GCs. The below bar plots showed comparison of TDP in GCs with or without GD (c) and TP53 mutation (d). The bottom bar plots exhibited comparison of TDP subgroups and oncogenic drivers: e TDP group 2 and CCNE1 BFB status; f TDP group 1 and 1/2mix and MUC16 somatic mutation status. P values were derived from Fisher’s exact tests. TDP tandem duplication phenotype, GC gastric cancer, BFB breakage-fusion-bridge

