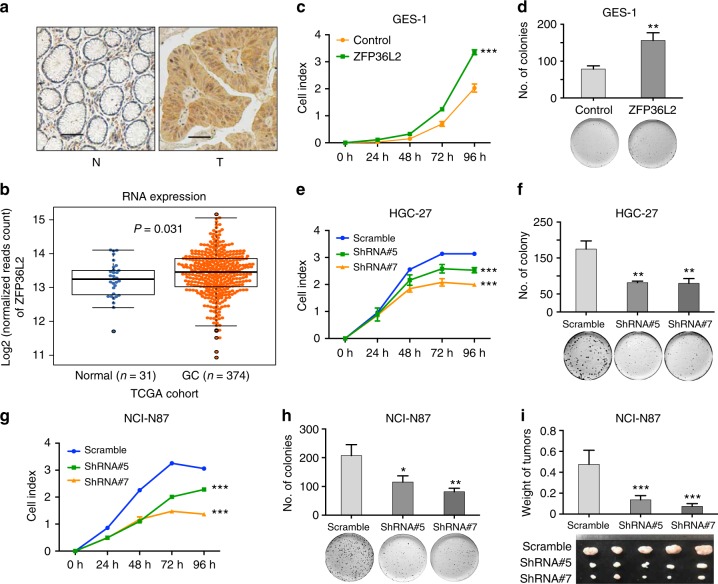
Fig. 3.
Highly expressed ZFP36L2 induced by amplification promotes cell growth. a Immunohistochemistry detection of ZFP36L2 expression in GC samples with amplification. Scale bars 25 μm. b Comparison of ZFP36L2 mRNA expression between matched nonmalignant tissues and tumor samples in the TCGA GC cohort. Center line represents the median of mRNA expression and P value was derived from Wilcoxon rank-sum test. c, d Overexpression of ZFP36L2 significantly promoted cell growth in GES-1 cells, the normal gastric epithelial cell line, as monitored by c RTCA and d colony formation assay. P values were derived from t tests. **P ≤ 0.01; ***P ≤ 0.001. Error bars represent ± s.d. of three experiments. e, f Knock-down of ZFP36L2 significantly inhibited cell growth in HGC-27 cells, a GC cell line, as monitored by e RTCA and f colony formation assay. P values were derived from t tests. **P ≤ 0.01; ***P ≤ 0.001. Error bars represent ± s.d. of three experiments. g, h Knock-down of ZFP36L2 significantly inhibited cell growth in NCI-N87 cells, a GC cell line, as monitored by g RTCA and h colony formation assay. P values were derived from t tests. *P ≤ 0.05; **P ≤ 0.01; ***P ≤ 0.001. Error bars represent ± s.d. of three experiments. i The photograph of tumors obtained from nude mice injected with NCI-N87 cell transfected with shRNAs against ZFP36L2 or control. P values were derived from t tests. ***P ≤ 0.001. Error bars represent ± s.d. of five nude mice GC gastric cancer

