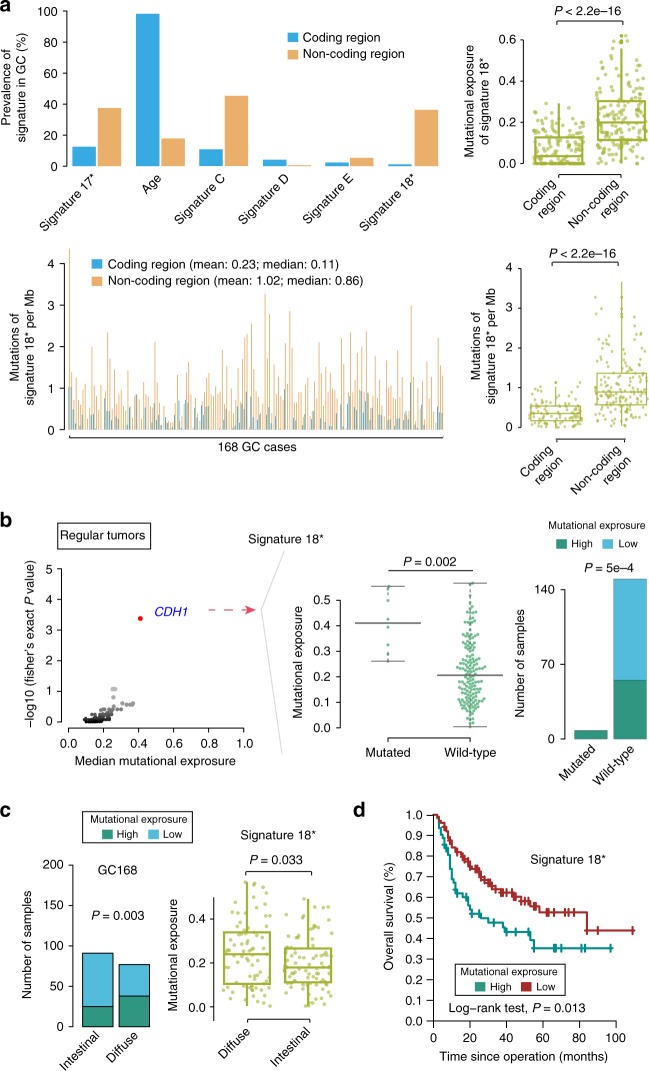
Fig. 6.
Summary of the presence of mutational signature 18* in 168 GC specimens. a Prevalence of each mutational signature and mutation of signature 18* per Mb across GCs between noncoding and coding regions. In the left panel, the X-axis shows the signatures or each sample, and the Y-axis shows the proportion of samples or mutation of signature 18* per Mb in the coding or noncoding region. Mutational exposure or mutation of signature 18* per Mb of signature 18* in the coding or noncoding region was revealed (right). One dot represents one sample. P values were derived from t tests. b (left) Mutational-exposure analysis revealed an association between somatic CDH1 mutations (regular tumors referred to those which are without somatic hypermutation) and mutational signature 18*. High mutational-signature contribution was defined as GC with mutational-signature contributions >25%. Genes mutated in >4% of samples were chosen from our cohort. Genes with a false discovery rate (q) <0.1 are highlighted in red. CDH1 was the only gene showing a significant difference. The P value for evaluating mutational-exposure between CDH1 status was derived from t tests. Center line of boxplot represents the median of mutational exposure of signature 18*. b (right) The contribution of signature 18* was compared in wild-type versus mutated tumors. P values were derived from Fisher tests. c Relationship between signature 18* and diffuse-type GC in our cohort. One dot represents one sample. P values were derived from Fisher tests and t tests. d Kaplan−Meier survival curves show the survival outcomes of signature 18* in GC. High mutational-signature contribution represents mutational-signature contributions ≥25%. GC gastric cancer

