Fig. 3.
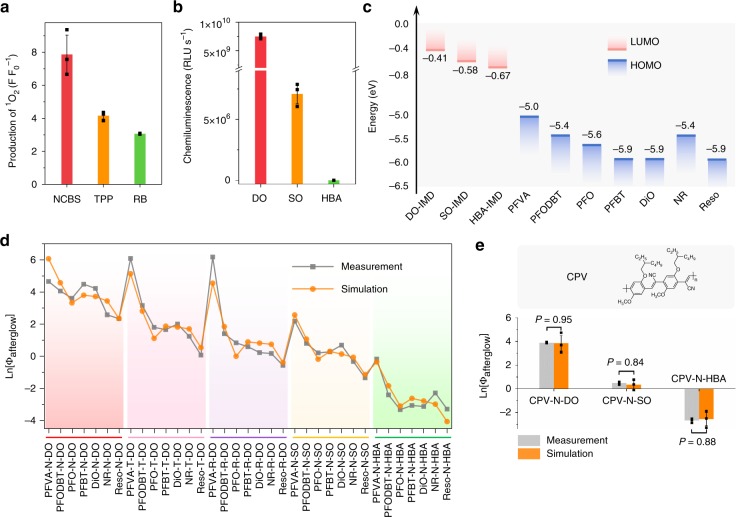
Mechanistic study of descriptors in the estimation of afterglow intensity of ALNPs. a Quantification of 1O2 generating capability for the different afterglow initiator doped nanoparticles at identical mass concentration (0.75 μg mL−1) in 1 × PBS (pH = 7.4). NCBS nanoparticles were pre-irradiated at 808 nm for 5 s (at 1 W cm−2), while TPP and RB nanoparticles were pre-irradiated with white light for 5 s (0.1 W cm−2). Production of 1O2 was defined as the fluorescence enhancement (F F0−1) of 1O2 sensor green (SOSG, 1 μM) at 524 nm. b Chemiluminescent intensities (RLU s−1) of DO, SO, and HBA in the presence of NCBS in tetrahydrofuran after pre-irradiation at 808 nm for 5 s (at 1 W cm−2). [DO] = [SO] = [HBA] = 15 μg mL−1; [NCBS] = 0.75 μg mL−1. RLU, relative light unit. c Schematic illustration of energy levels of afterglow substrates and afterglow relay units39,47,48. LUMO, lowest unoccupied molecular orbitals. DO/SO/HBA-IMD, DO/SO/HBA-based dioxetane intermediate. d Measured (measurement) and estimated (simulation) afterglow intensities of ALNPs. Estimated afterglow intensities were calculated from Eq. (1). e Prediction of afterglow intensities of a new afterglow relay unit CPV by Eq. (1). P values were calculated by Student’s two-sided t-test. Inset: chemical structure of CPV. Error bars indicated standard deviations of three separate measurements

