Fig. 4.
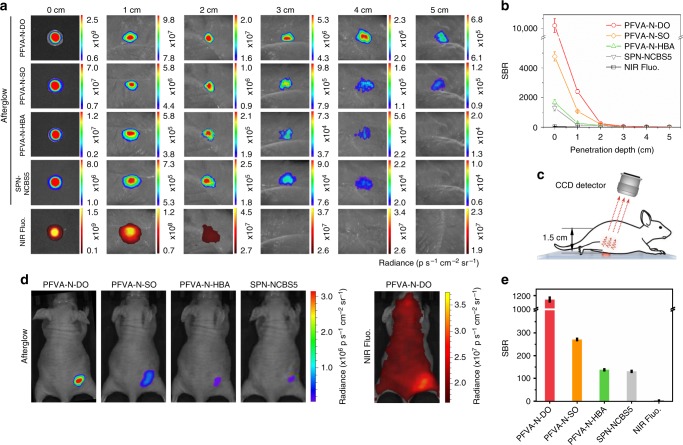
Tissue penetration study of ALNPs. a Afterglow and NIR fluorescence images of PFVA-based ALNPs ([PFVA] = 100 μg mL−1, [DO], [SO], or [HBA] = 50 μg mL−1, [NCBS] = 2.5 μg mL−1, 50 μL) and SPN-NCBS5 nanoparticles ([MEHPPV] = 100 μg mL−1, [NCBS] = 5 μg mL−1, 50 μL) under different depths of chicken breast tissues. b SBRs of afterglow or fluorescence images in (a) at different tissue depths. c Schematic illustration of optical imaging through a living mouse. Afterglow and NIR fluorescence images of PFVA-based ALNPs or SPN-NCBS5 were captured after penetrating through a living mouse. CCD, charged coupled device. d Afterglow and fluorescence images of PFVA-based ALNPs or SPN-NCBS5 nanoparticles penetrating through a living mouse. Concentrations of nanoparticles were identical to those in (b). e Quantification of the SBRs of afterglow or fluorescence images in (d). Both the PFVA-based ALNPs and SPN-NCBS5 were pre-irradiated at 808 nm for 5 s (at 1 W cm−2) before imaging. Fluorescence images were captured at 780 nm upon excitation at 710 nm. Error bars indicated standard deviations of three separate measurements

