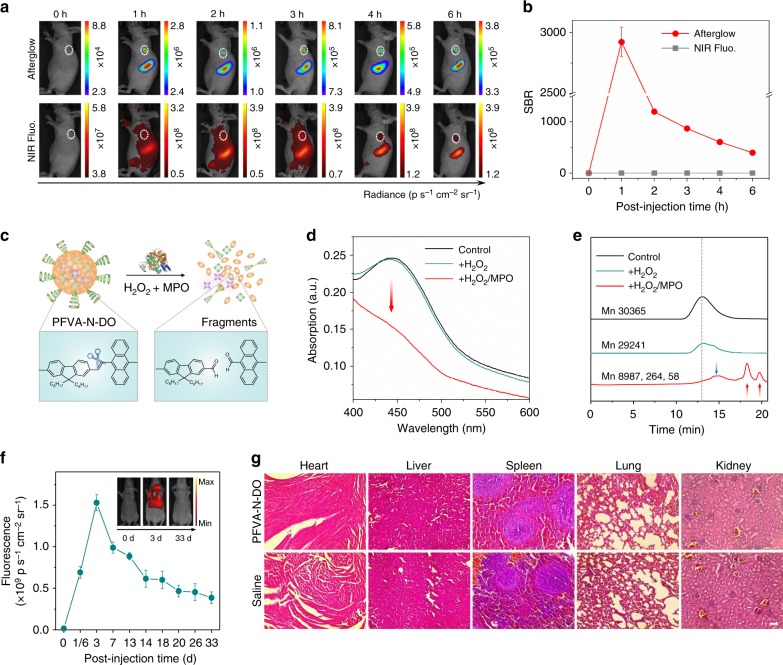
Fig. 5.
In vivo imaging, biodegradation, and clearance studies of ALNPs. a Representative afterglow and NIR fluorescence images of 4T1 xenograft tumor bearing mice at the different time points after tail vein injection of PFVA-N-DO ([PFVA] = 250 μg mL−1, [DO] = 125 μg mL−1, [NCBS] = 6.25 μg mL−1, 250 μL). Afterglow images were acquired after pre-irradiation of mice at 808 nm laser for 5 s (0.3 W cm−2). Fluorescence images were acquired at 780 nm upon excitation at 710 nm. White dashed circles indicated location of tumor. b SBRs of afterglow and NIR fluorescence imaging in tumor region as a function of time in (a). c Proposed mechanism of biodegradation of PFVA-N-DO nanoparticles by the mixture of MPO and H2O2. d Absorption spectra of PFVA-N-DO ([PFVA] = 4 μg mL−1) after incubation with buffer (control), H2O2 (300 mM), or MPO (50 μg mL−1)/H2O2 (300 mM) at 37 °C for 24 h in 100 mM PBS (pH = 7.0). e GPC results of ALNP solutions in (d). f Quantification of the NIR fluorescence intensities of liver region in living mice as a function of time after intravenous injection of PFVA-N-DO ([PFVA] = 250 μg mL−1, [DO] = 125 μg mL−1, [NCBS] = 6.25 μg mL−1, 250 μL). NIR fluorescence images were acquired at 780 nm upon excitation at 710 nm. g Hematoxylin & eosin staining of major organs from mice after tail vein injection of PFVA-N-DO ALNPs ([PFVA] = 250 μg mL−1, [DO] = 125 μg mL−1, [NCBS] = 6.25 μg mL−1, 250 μL) or saline (250 μL) for 33 days. Scale bar: 50 µm. Error bars indicated standard deviations of three separate measurements (n = 3)

