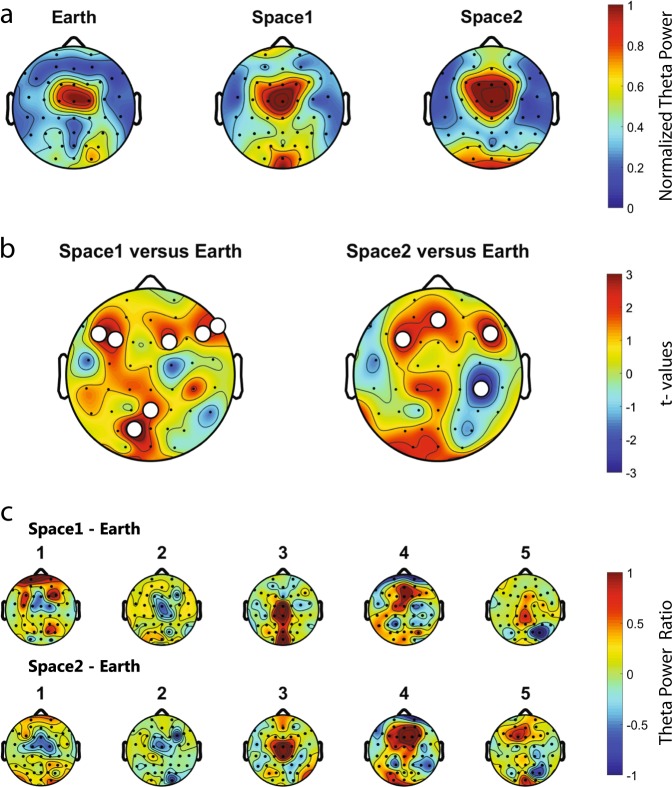
Fig. 2.
Theta power topographical distribution across the recording conditions. a Normalised theta power for Earth, space1 and space2. Consistent central distribution of the theta power in all conditions. b In space1 and space2 compared to Earth, theta is globally increased for a majority of astronauts. Red colour indicates an increase of theta power in space compared to Earth (paired t-test, t-values, white dots uncorrected p-values < 0.05). c Space1-Earth and space2-Earth differences in theta power for each astronaut (1–5). Differences in theta power from space to Earth are observed but no clear topographical pattern emerges. (n = 5 astronauts)

