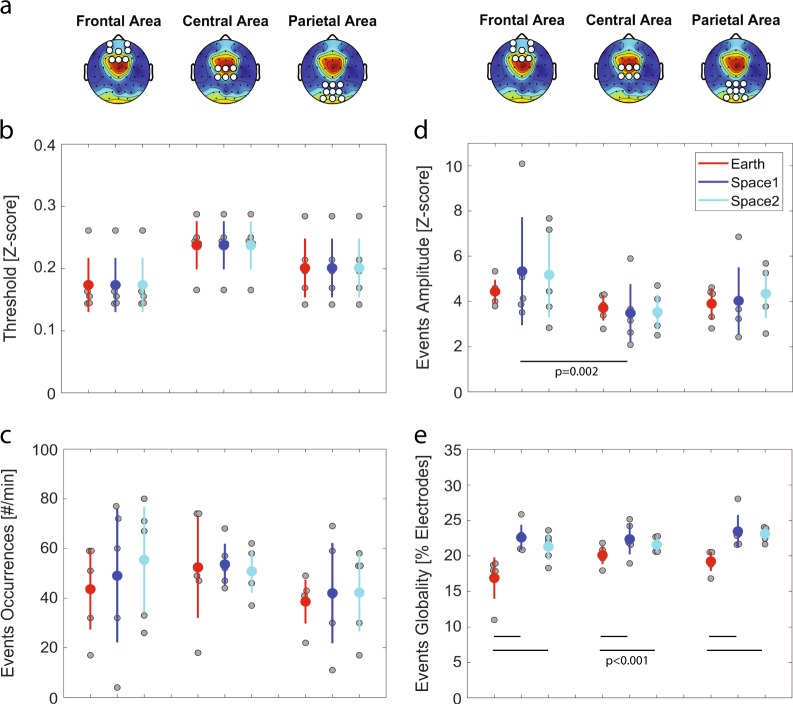
Fig. 3.
Local sleep-like events’ properties. a Topographical distribution of theta power in space2. The white dots define the three non-overlapping areas (frontal, central and parietal) used for the detection of local sleep-like events. b The voltage at each channel is standardised by z-score transform. A detection threshold is defined for each astronaut within each area (i.e., frontal, central or parietal area). Each grey dot represents the mean value for one astronaut and the mean ± sem across astronauts are colour marked as a dot and a line, respectively. c No difference in the number of local sleep-like events selected in each area and across conditions. d Increase of the amplitude for local sleep-like events in the frontal area compared to the central area. e Increase of the globality for local sleep-like events from Earth to space. (n = 5 astronauts)

