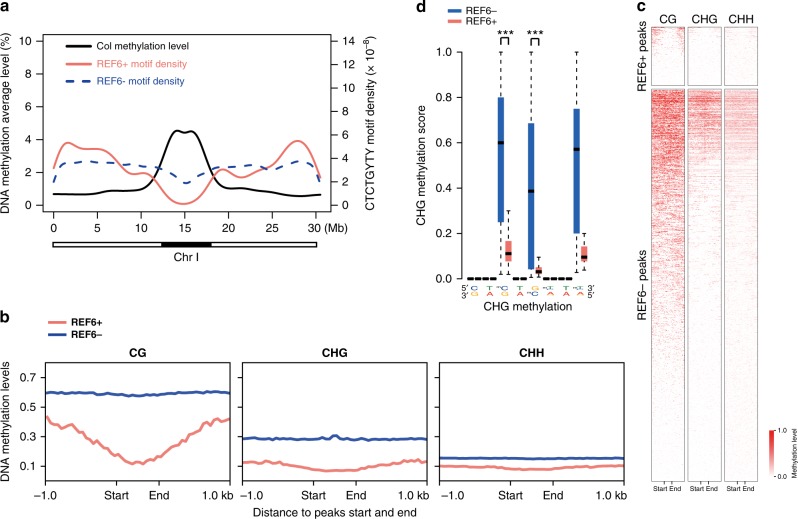
Fig. 1.
REF6 prefers to bind DNA hypo-methylated regions. a DNA methylation level, as well as REF6 bound and unbound motif density, on Chromosome I. The black bar below the panel shows the position of heterochromatin. b Average distribution of DNA methylation levels (CG, CHG, CHH) over central regions within REF6-bound (REF6+) and REF6-unbound (REF6−) motifs; peak “start” and “end” sites are separated by 600 bp. REF6− regions were constructed as described in “Methods”. c Heatmap of DNA methylation levels within REF6-bound and REF6-unbound regions. d CHG methylation levels at CTCTGYTY motifs in REF6-bound (REF6+) and unbound (REF6−) regions. The box plots display the median (center line) and interquartile range (IQR; from the 25th to 75th percentile), and the whiskers represent the minimum and maximum of DNA methylation score from 0 to 1. Mann–Whitney U-test was used to calculate the P-value. ***P < 0.001

