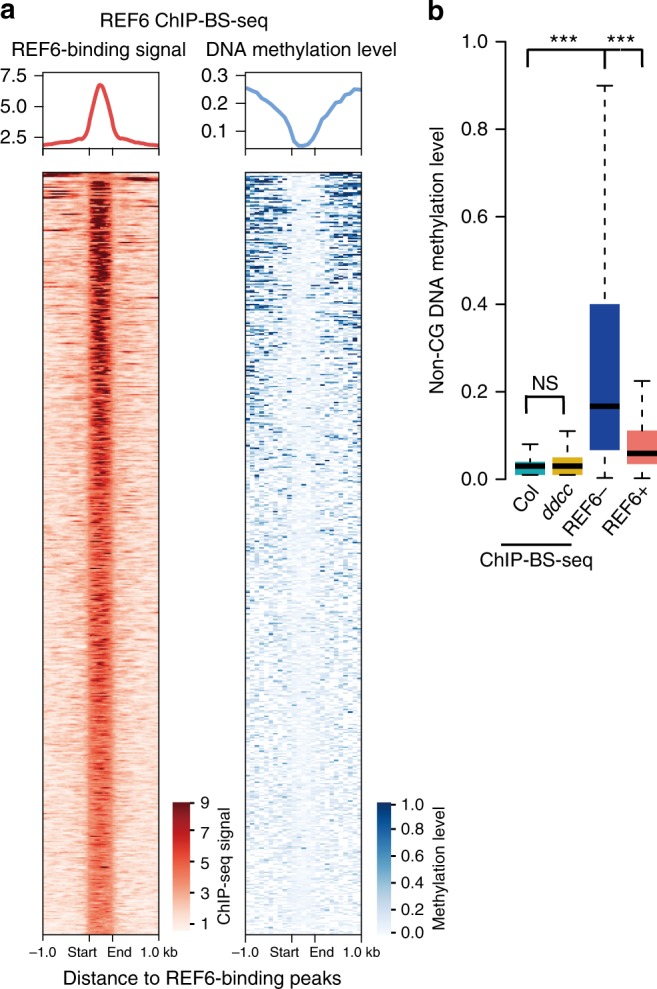
Fig. 2.

REF6 prefer to bind hypomethylated regions in Arabidopsis genome. a Heat maps of REF6 occupancy and DNA methylation level in 1.0 kb surrounding REF6-binding peaks. b Box plots showing average non-CG DNA methylation level of in vivo REF6-binding regions. The DNA methylation levels of REF6-binding regions in Col and ddcc are measured by ChIP-BS-seq data, while those in REF6-bound (REF6+) and REF6-unbound (REF6−) regions are measured by whole genome bisulfate sequencing in Col from WGBS data. In vivo REF6-binding regions and REF6+ show significant difference (Mann–Whitney U-test, P < 2.2e−16) to REF6− motifs. NS, not significant. The median (center line), interquartile range (IQR; from the 25th to 75th percentile) and the ends of whiskers indicating the minimum and maximum of DNA methylation score from 0 to 1, are shown in the boxplots. Mann–Whitney U-test was used to calculate the P value. ***P < 0.001
