Fig. 5.
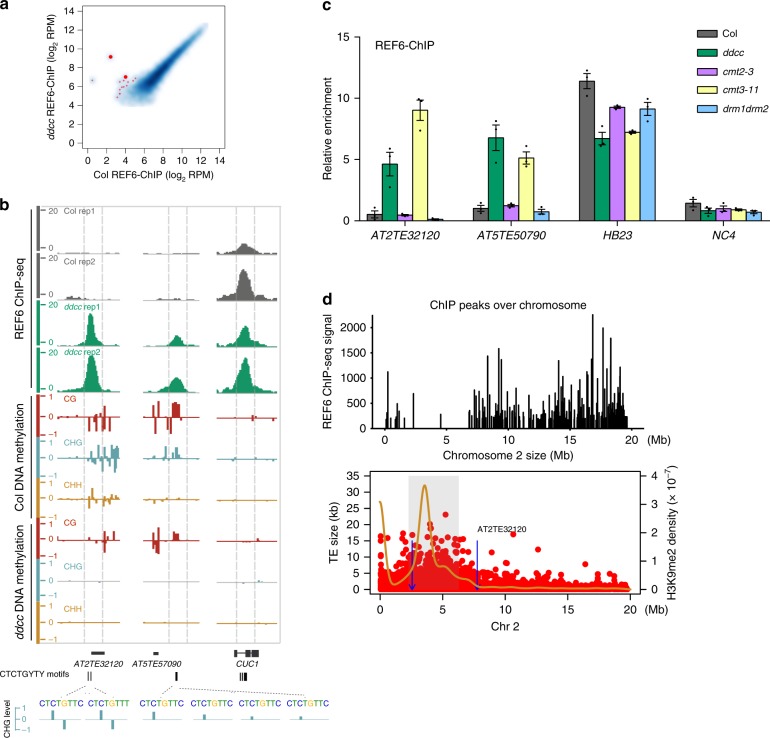
DNA methylation represses REF6 binding at specific loci. a REF6 ChIP-seq signal at all regions in wild-type Col and the ddcc mutant. The thick red dots represent the region in b. b Genome-browser view of REF6 binding and DNA methylation in Col and the ddcc mutant at the AT2TE32120 and AT5TE57090 loci. The CUC1 locus was used as the control. Gene models from TAIR10 are shown in black at the bottom of the panel. c ChIP-qPCR validation of REF6 binding at AT2TE32120 and AT5TE57090, using ChIP samples of another biological replicate, in wild-type Col and the ddcc, cmt2-3, cmt3-11, and drm1 drm2 mutants. HB23 and NC4 were used as positive and negative controls, respectively. ChIP-qPCR was performed in three technical replicates. Error bars indicate mean ± SE from three independent experiments. The individual data points are shown as dots. Source data are provided as a Source Data file. d Distribution of REF6 ChIP-seq signal, TEs (red dot), and H3K9me2 density (yellow line) across chromosome 2. Blue lines with arrows indicate ectopic-binding sites in ddcc mutants, one of which is shown at the top right corner. Gray shading covering the area of high H3K9me2 density represent the heterochromatin regions

