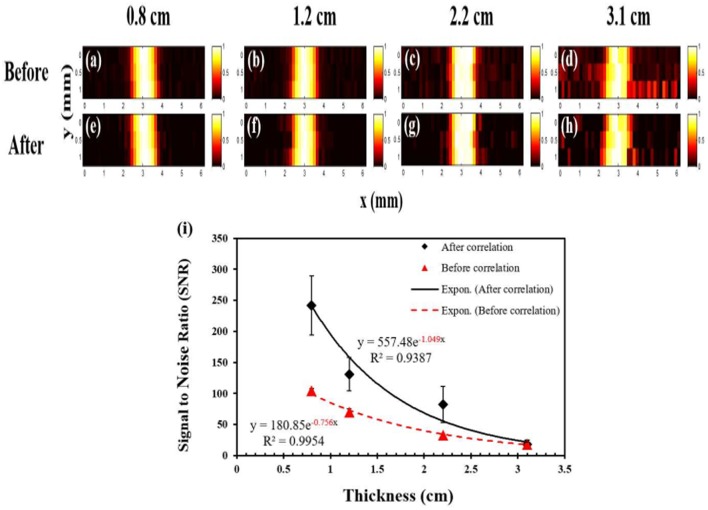
Figure 8.
USF images of micro-tubes in porcine muscle tissue samples (Cheng et al., 2016). (a–d) The USF images of the micro-tubes (before correlation) that were embedded into pork muscle tissue samples with thicknesses of 0.8, 1.2, 2.2, and 3.1 cm, respectively. The I.D./O.D. of the tube is 0.31/0.64 mm; (e–h) The corresponding USF images processed by the correlation algorithm. (a–h) scales: X axis: 0-6 mm; Y axis: 0-1 mm. (i) The relationship between the SNR and the thickness of the sample before (triangles) and after (diamonds) the correlation processing (error bar: mean±standard deviation). Reproduced with permission. Copyright 2016©PLOS.

