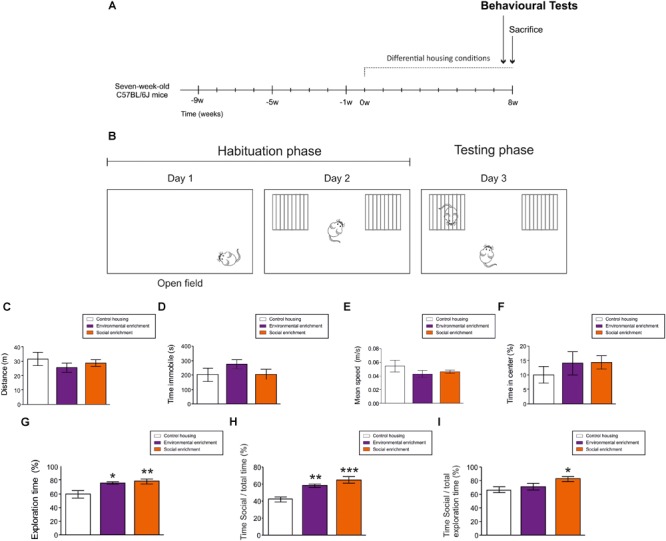
FIGURE 2.

Behavioral effects of Environmental enrichment (EE) and Social enrichment (SE). (A) Experimental design. (B) Schematic diagram of behavioral test performed. (C) Total distance moved in Open field test. (D) Total time immobile in Open field test. (E) Mean speed in Open field test. (F) Percentage of time spent in the central part of the arena in Open field test. (G) Total exploration time during day 2. (H) Percentage of time exploring the cage holding a mouse divided by the total testing time during day 3. (I) Percentage of time exploring the cage holding a mouse divided by the total exploratory time during day 3. ∗0.05 > p ≥ 0.01; ∗∗0.01 > p ≥ 0.001; ∗∗∗p < 0.001. Asterisks indicate changes with respect to control housing animals.
