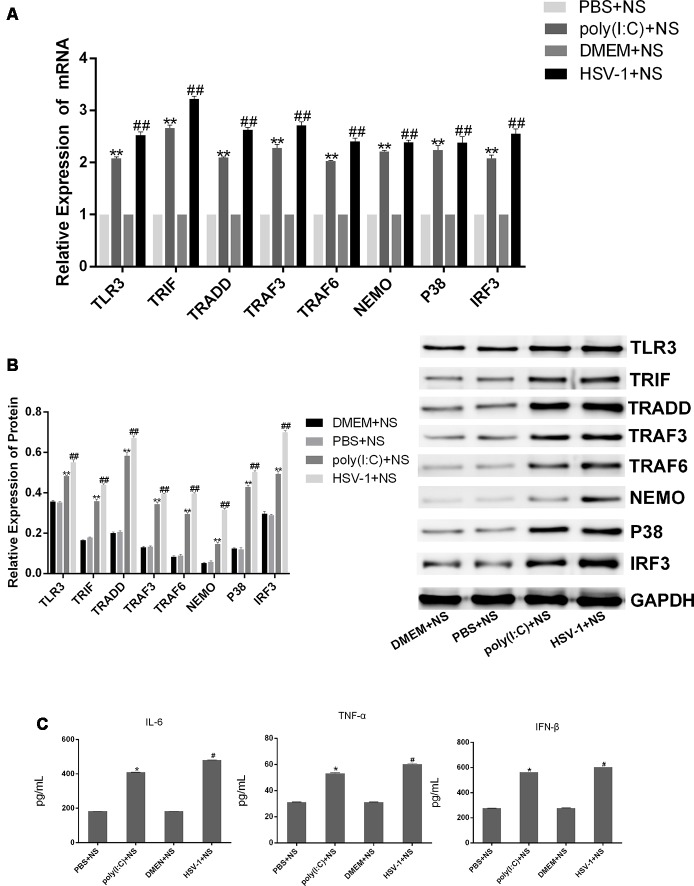
Figure 10.
The expression of TLR3 and its downstream molecules in brain tissues of mice with encephalitis. DMEM (20 μL), PBS (20 μL), poly(I:C; 5 mg/kg, 20 μL), and HSV-1 (10−4/20 μL) were injected into the intracalvarium at the midpoint of the line from the right canthus to the external auditory canal. After the model was established for 1 h, five mice in each group were intragastrically treated with NS, Corilagin 40 mg/kg, ACV 350 mg/kg each day. (A) The mRNA levels of TLR3 and its downstream molecules in brain tissues were detected by RT-PCR. (B) The protein levels of TLR3 and its downstream molecules in brain tissues were measured by western blotting. (C) The levels of TNF-α, IL-6, and IFN-β in brain tissues were measured by ELISA. Data are shown as the mean ± SD of three independent experiments of triplicate samples. *P < 0.05, **P < 0.01 for poly(I:C)+NS vs. PBS+NS, #P < 0.05, ##P < 0.01 for HSV-1+NS vs. DMEM+NS (by Student’s t-test).

