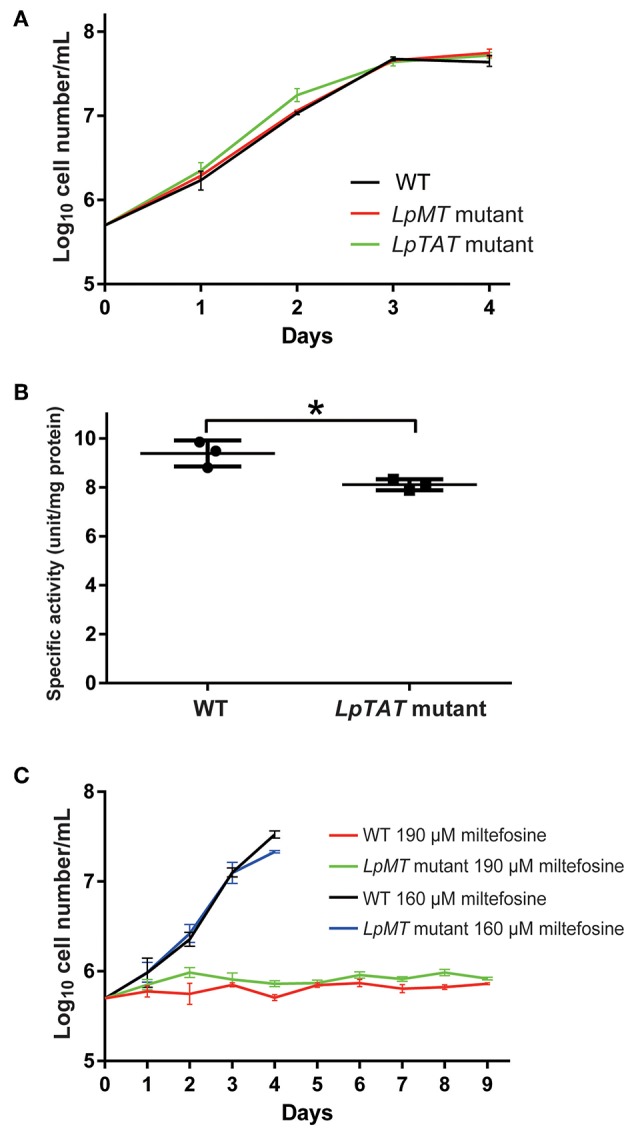
Figure 8.

Phenotypic characterization of LpMT and LpTAT null mutants. (A) Growth of LpMT (red) LpTAT (green) mutants together with wild type (WT, black) in the modified FP-FB medium. The experiments were repeated three times and the mean value with error bar (± SD) is indicated for each time point. There is no statistical difference between WT and two mutants except WT and LpTAT mutant at day 2 (P < 0.006) by two-tailed Dunnett test. (B) Specific activity of tyrosine aminotransferase in wild type (WT) and LpTAT mutant. Three protein samples were analyzed for each genotype and asterisk (*) indicates the statistical difference between two groups (P < 0.02) by one-tailed Welch's t-test. (C) Growth rates of wild type and LpMT mutant in the culture medium with either 160 μM (black and blue) or 190 μM (red and green) miltefosine. The experiments were repeated three times and the mean value with error bar (± SD) is indicated for each time point. In the presence of 160 μM miltefosine, there is no statistical difference between WT and LpMT mutant except at day 4 (P < 0.02) by two-tailed Welch's t-test. With 190 μM miltefosine, WT and LpMT mutant are statistically different except at day 1, 3, and 5. P-values between them are <0.03, <0.008, <0.05, <0.03, <0.01, and <0.02 at day 2, 4, and 6–9, respectively by two-tailed Welch's t-test.
