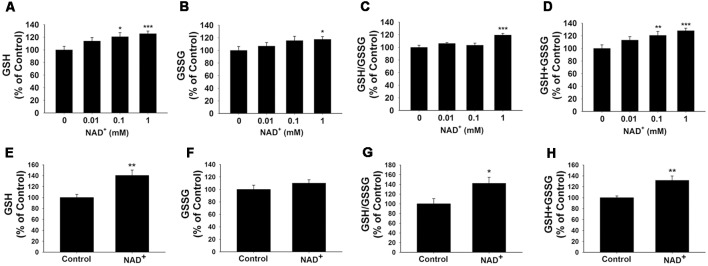
Figure 1.
NAD+ treatment increased the glutathione levels and GSH/GSSG ratio in PC12 cells. (A) NAD+ treatment dose-dependently increased the GSH level in PC12 cells. Analysis of variance (ANOVA: F = 3.695, p = 0.0234). (B) One millimolar NAD+ slightly increased the GSSG level in the cells, while lower concentrations of NAD+ did not affect the GSSG level (ANOVA: F = 3.115, p = 0.434). (C) One millimolar NAD+ significantly increased the GSH/GSSG ratio in the cells, while lower concentrations of NAD+ did not affect the GSH/GSSG ratio (ANOVA: F = 7.325, p = 0.001). (D) NAD+ treatment dose-dependently increased the total glutathione level in the cells (ANOVA: F = 8.338, p = 0.0004). For (A–D), the assays on GSH and GSSG were conducted, after the cells were treated with NAD+ for 24 h. N = 12. (E) NAD+ treatment increased the GSH level in primary astrocytes. (F) NAD+ treatment did not affect the GSSG level in primary astrocytes. (G) NAD+ treatment increased the GSH/GSSG ratio in primary astrocytes. (H) NAD+ treatment increased total glutathione levels in primary astrocytes. For (E–H), primary astrocytes were treated with 1 mM NAD+ for 24 h before the assays were conducted. N = 9. The data were pooled from three independent experiments. *p < 0.05; **p < 0.01; ***p < 0.001.

