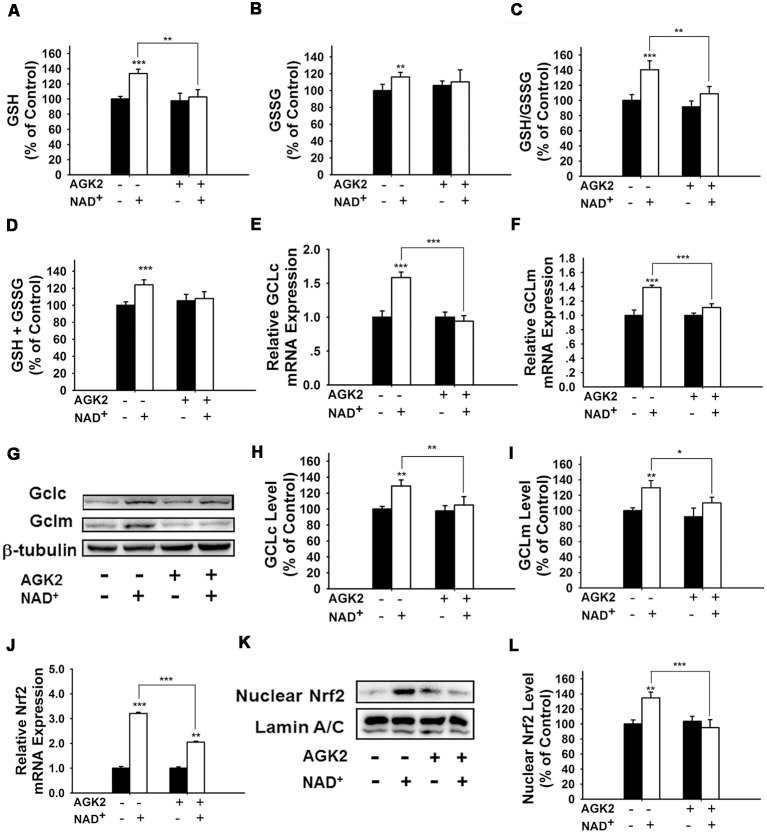
Figure 4.
The SIRT2 inhibitor AGK2 prevented the NAD+-induced increases in the glutathione levels, GSH/GSSG ratio, glutamylcysteine ligase (GCL) level and nuclear Nrf2 level of PC12 cells. (A) AGK2 prevented the NAD+-induced increase in the GSH levels (effect of NAD+ treatment, F(1,36) = 15.91, p = 0.0003; effect of AGK2 treatment, F(1,36) = 4.282, p = 0.0457; effect of AGK2 * NAD+ treatment, F(1,36) = 6.875, p = 0.0127). (B) AGK2 prevented the NAD+-induced increase in the GSSG levels (effect of NAD+ treatment, F(1,36) = 25.84, p < 0.0001; effect of AGK2 treatment, F(1,36) = 2.402, p = 0.1299; effect of AGK2 * NAD+ treatment, F(1,36) = 7.422, p = 0.0099). (C) AGK2 prevented the NAD+-induced increase in the GSH/GSSG ratio (effect of NAD+ treatment, F(1,36) = 20.21, p < 0.0001; effect of AGK2 treatment, F(1,36) = 8.883, p = 0.0051; effect of AGK2 * NAD+ treatment, F(1,36) = 5.841, p = 0.0209). (D) AGK2 prevented the NAD+-induced increase in the total glutathione level (effect of NAD+ treatment, F(1,36) = 4.292, p = 0.0455; effect of AGK2 treatment, F(1,36) = 0.1002, p = 0.7534; effect of AGK2 * NAD+ treatment, F(1,36) = 1.769, p = 0.1919). For (A–D), the assays were conducted after the cells were treated with 1 mM NAD+ and 5 μM AGK2 for 24 h. (E) AGK2 prevented the NAD+-induced increase in the GCLc mRNA level of the cells, assessed at 6 h after the NAD+ treatment (effect of NAD+ treatment, F(1,44) = 15.46, p = 0.0003; effect of AGK2 treatment, F(1,44) = 10.24, p = 0.0026; effect of AGK2 * NAD+ treatment, F(1,44) = 15.59, p = 0.0003). (F) AGK2 prevented the NAD+-induced increase in the GCLm mRNA level of the cells, assessed at 6 h after the NAD+ treatment (effect of NAD+ treatment, F(1,44) = 52.53, p < 0.0001; effect of AGK2 treatment, F(1,44) = 9.449, p = 0.0036; effect of AGK2 * NAD+ treatment, F(1,44) = 20.06, p < 0.0001). (G) Representative western blot bands of GCLc and GCLm. (H) AGK2 prevented the NAD+-induced increases in the protein levels of GCLc in PC12 cells, assessed at 12 h after the NAD+ treatment (effect of NAD+ treatment, F(1,36) = 9.982, p = 0.0032; effect of AGK2 treatment, F(1,36) = 5.051, p = 0.0245; effect of AGK2 * NAD+ treatment, F(1,36) = 3.86, p = 0.0572). (I) AGK2 prevented the NAD+-induced increases in the protein levels of GCLm in PC12 cells, assessed at 12 h after the NAD+ treatment (effect of NAD+ treatment, F(1,36) = 9.831, p = 0.0034; effect of AGK2 treatment, F(1,36) = 2.646, p = 0.1125; effect of AGK2 * NAD+ treatment, F(1,36) = 5.171, p = 0.029). (J) AGK2 prevented the NAD+-induced increase in the Nrf2 mRNA level of the cells, assessed at 6 h after the NAD+ treatment (effect of NAD+ treatment, F(1,36) = 9.982, p = 0.0032; effect of AGK2 treatment, F(1,36) = 5051, p = 0.0245; effect of AGK2 * NAD+ treatment, F(1,36) = 3.86, p = 0.0572). (K) Representative western blot bands of nuclear Nrf2. (L) AGK2 prevented the NAD+-induced nuclear translocation of Nrf2, assessed at 1 h after the cells were treated with 1 mM NAD+ and 5 μM AGK2 (effect of NAD+ treatment, F(1,32) = 3.753, p = 0.0616; effect of AGK2 treatment, F(1,32) = 7.13, p = 0.0118; effect of AGK2 * NAD+ treatment, F(1,32) = 10.28, p = 0.0030). The data were pooled from four independent experiments. *p < 0.05; **p < 0.01; ***p < 0.001.

