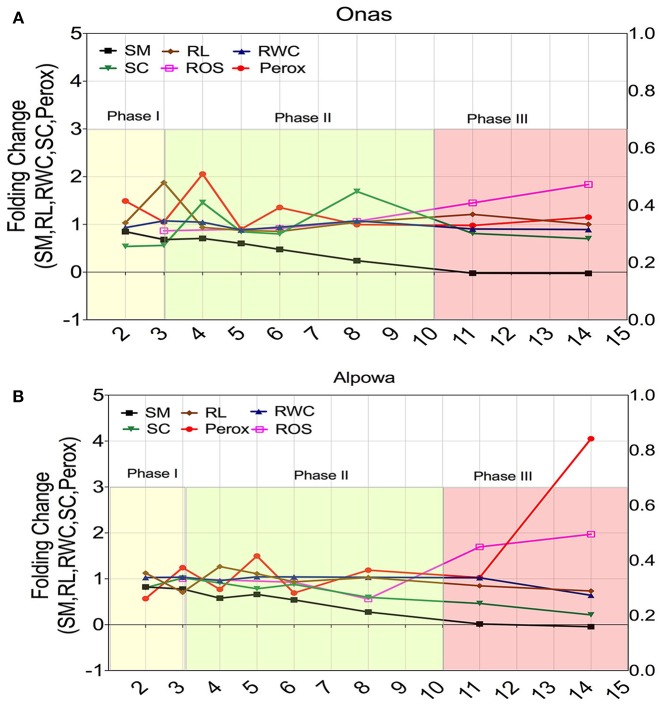
Figure 8.
Dynamic changes of the; soil moisture (SM), root length (RL), relative water content (RWC), stomatal conductance (SC), peroxisome abundance (Perox), and ROS content (ROS) during three successive phases of drought in a selection of two genotypes that had shown contrasting phenotypic performance under drought. (A) The dynamic changes in the tolerant genotype (Onas), while (B) illustrates the dynamic changes in the susceptible genotype (Alpowa). The y-axis represents the folding change of each trait in relation to the non-stressed groups, while the x-axis represents the time points (days) during drought phases. The beginning of phase II discriminated the dynamics of peroxisome abundance and stomatal conductance of the tolerant response, while the end of phase III discriminated the susceptible response.

