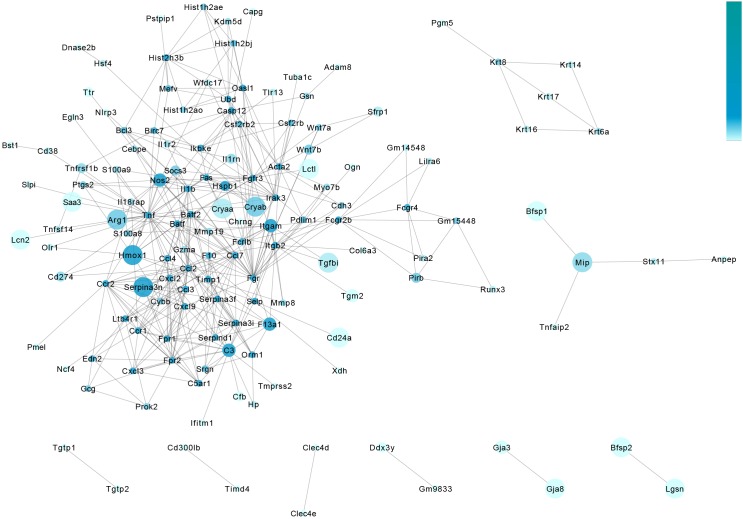
FIGURE 6.
Protein–protein interaction analysis of the retina in metformin-treated and PBS-treated rd1 mice at P14. The gene-act-network was constructed based on the interactions among genes identified in the STRING database. Each node (blue circle) represents a gene. Lines represent interactive relationships between two signaling pathways. We represent the significance of differences in genes in terms of the size of the circle, and the clustering coefficient is represented by the shade of the circle in blue. A darker color indicates more associated genes.

