FIGURE 8.
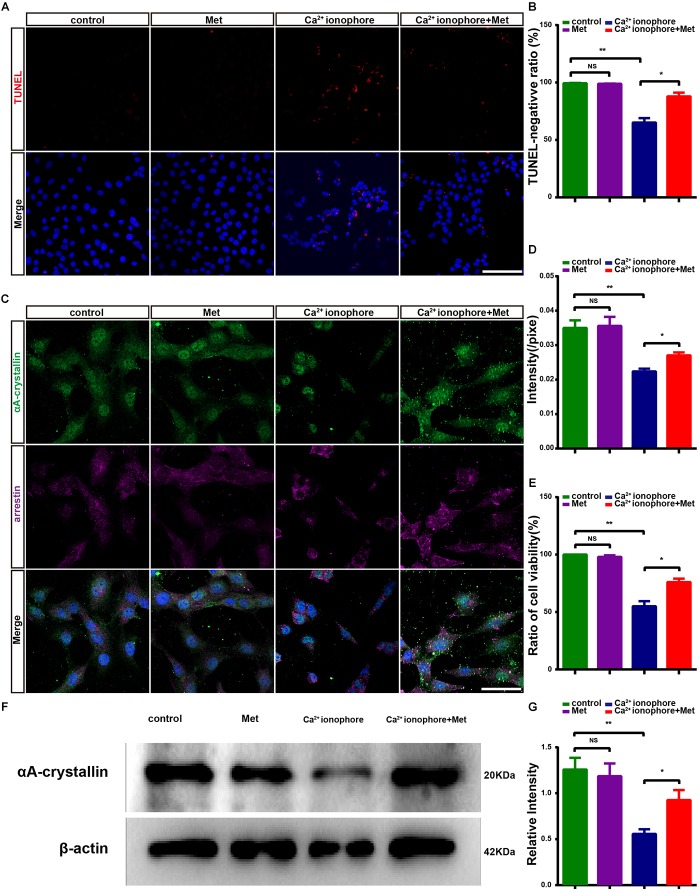
Metformin protects 661W cells from Ca2+ ionophore damage by increasing αA-crystallin expression. (A) Representative images of immunofluorescence for TUNEL (red) and DAPI (blue) in different groups: control; Met; Ca2+ ionophore; Ca2+ ionophore + Met. (B) Comparison of the number of TUNEL-negative cells in different groups. n = 5 samples per group. (C) Representative images of immunofluorescence for a 661W cell marker, anti-cone arrestin (purple) and αA-crystallin (green) and DAPI (blue) in different groups. (D) Comparison of the relative fluorescence intensities of αA-crystallin in different groups. n = 6 samples per group. (E) Comparison of cell viability in different groups in CCK8 assays. n = 5 samples per group. (F) Representative Western blot bands for αA-crystallin versus β-actin. (G) Comparison of protein grayscale semiquantitative analyses between the control group and the other three groups. n = 3 samples per group. Control: DMSO; Met: DMSO + metformin; Ca2+ ionophore: Ca2+ ionophore; Ca2+ ionophore + Met: Ca2+ ionophore + metformin. Data are presented as the mean ± SEM. NS, no significant difference. ∗P < 0.05, ∗∗P < 0.01. Scale bars: (A) 100 μm; (D) 50 μm.

