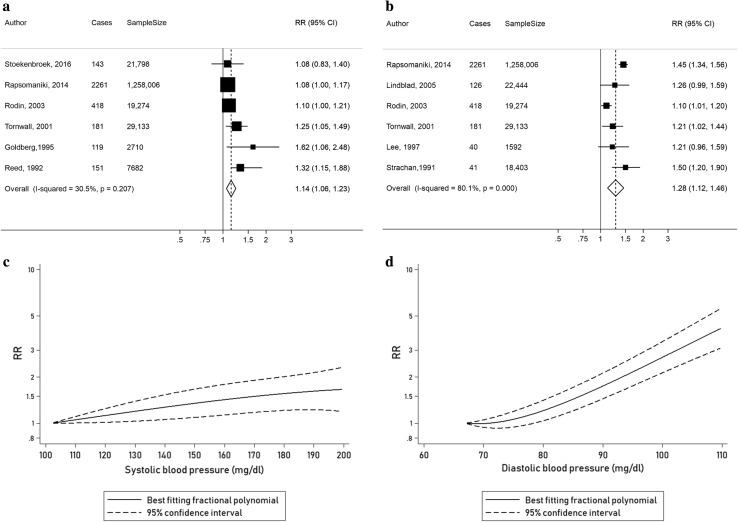
Fig. 3.
Linear and nonlinear dose–response analyses of SBP, DBP and risk of AAA, a linear dose–response analysis of SBP and risk of AAA, per 20 mmHg, b linear dose–response analysis of DBP and risk of AAA, per 10 mmHg, c nonlinear dose–response analysis of SBP and risk of AAA, d nonlinear dose–response analysis of DBP and risk of AAA

