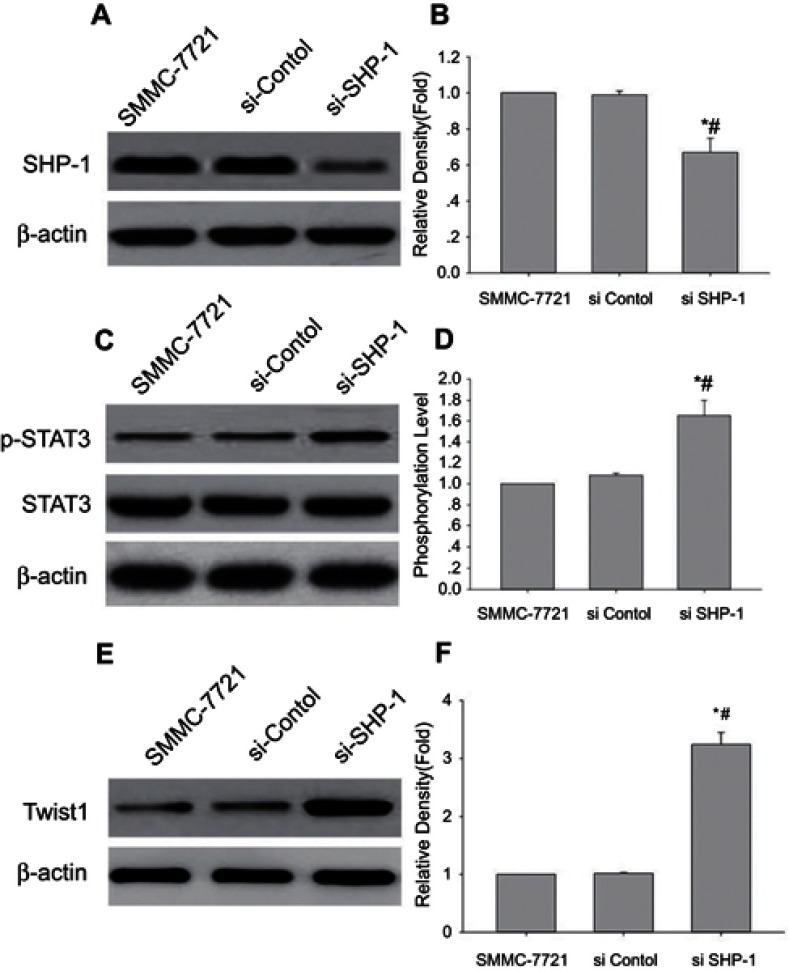
Figure 5.
Knockdown of SHP-1 induced the p-STAT3 and Twist1 expression. Western blot analysis has performed the levels of SHP-1, p-STAT3 (Tyr705) and Twist1 in SMMC-7721 cells transfected with SHP-1 siRNA; β-actin was used as an internal control. (A, C, and E) Representative blot from three independent experiments. (B, D, and F) relative density or phosphorylation level (Mean ± SD, n=3); *p<0.05 vs SMMC-7721 cell line; #p<0.05 vs SMMC-7721 cell line transfected with control.

