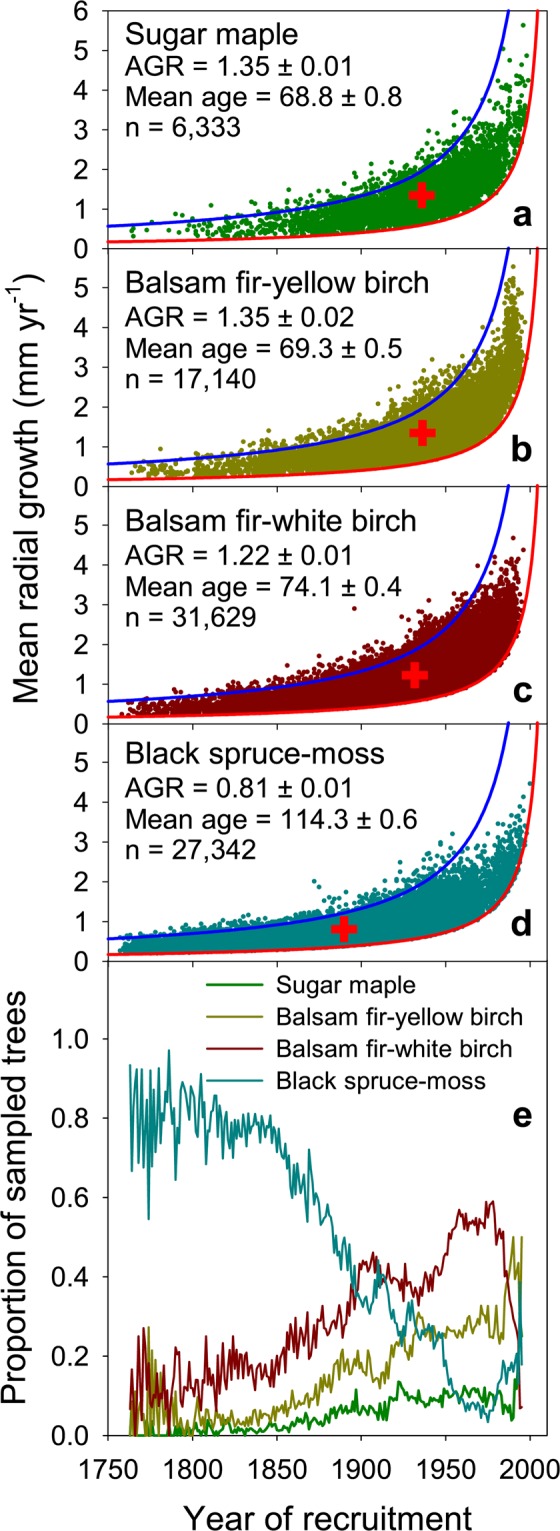
Figure 4.

Lifetime mean annual radial growth of individual black spruce trees aligned by year of recruitment (pith year, panels a–d) and proportion of sampled trees from yearly generations according to their location (bioclimatic domains, panel e, see Fig. 1). Red crosses indicate the mean annual radial growth rates and mean year of recruitment for each subset. Mean annual growth rate (AGR, mm yr−1), mean tree age (yr) and their 95% confidence intervals, and sample size (n) are given for each subset. See the legend of Fig. 3 for definition of blue and red lines in panels (a–d). Older tree cohorts are biased toward a higher proportion of slow-growing trees originating from less productive sites, while younger generations are biased toward a higher proportion of fast-growing trees from more productive sites. These biases induce spurious trends in historical growth rate reconstruction. The proportion series were truncated when sample replication dropped below 25.
