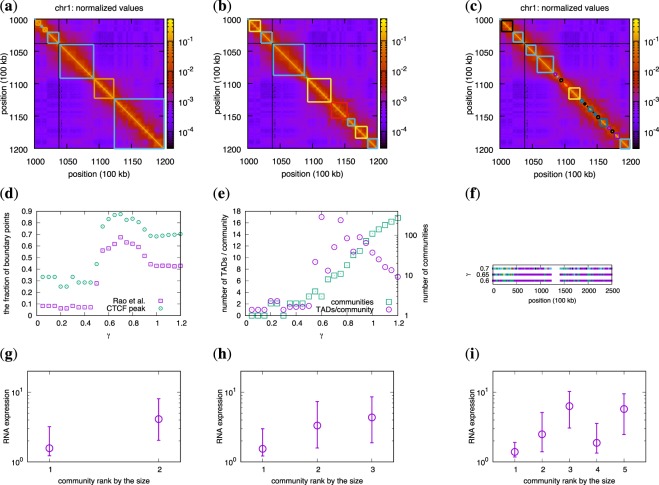
Figure 2.
3D communities in real Hi-C data (chromosome 1). (a–c) Normalized Hi-C data with squares showing the structure of 3D communities. The black regions are the unmappable regions. The resolution parameter ranges from γ = 0.6 (a), γ = 0.7 (b), and γ = 0.8 (c). As in Fig. 1(b–d), we assign the same colors to those squares that belong to the same 3D community. It is clear that they are not contiguous sequences. (d) The fraction of community boundary points predicted by our method that coincide with the ones in Rao et al.2 (the squares), and binding positions for CTCF (the circles) for different values of γ. (e) The average number of TADs for each community, and the number of communities as functions of γ. (f) The community division along chromosome 1 for three different values of γ. The purple squares represent the largest community in the panels (g)–(i), while the other colors indicate smaller communities. (g)–(i) Communities’ gene activity sorted by their relative size for different values of γ: (g) γ = 0.6, (h) γ = 0.65, and (i) γ = 0.7. The circles show the median RNA expression levels, and vertical lines are quartiles. We omit communities that are smaller than 50 nodes. We find the communities using Eqs (1 and 2).

