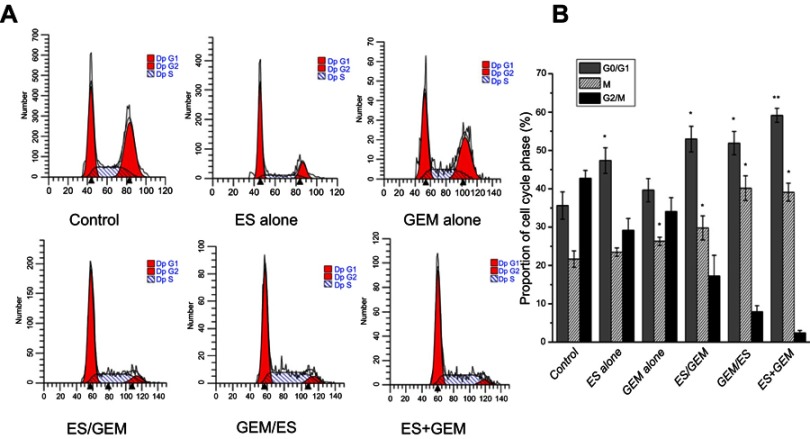
Figure 5.
Cell cycle analysis of tumor tissue from mice in different groups. (A) Flow cytometry analysis of cell cycle redistribution in xenografts from mice in different groups. (B) Percentage of cells in G0/G1, S, G2/M phase in mouse xenografts in different treatment groups. *P<0.05 vs control group, **P<0.05 vs all groups.
Abbreviations: ES, endostar; GEM, gemcitabine.

